|
IRI Climate Digest
April 2003
March Global Climate Summary
Climatological Background
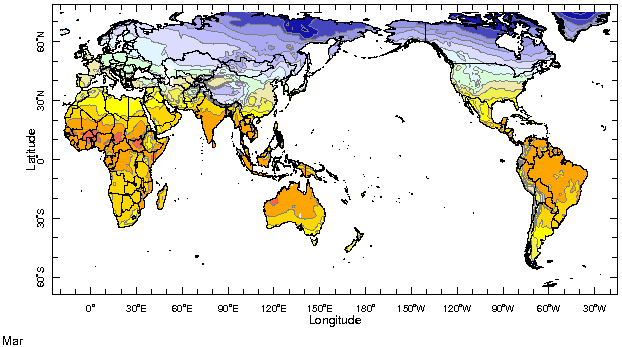
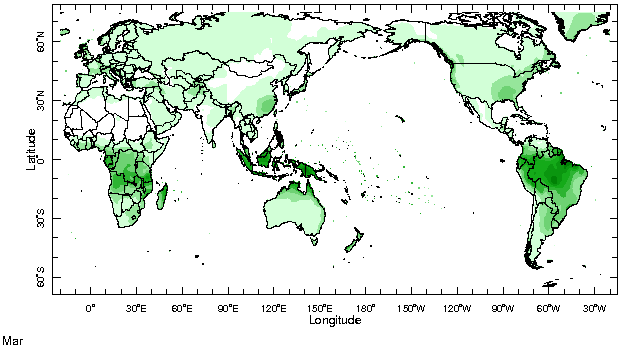
In March, the sun crosses the equator (the Equinox) and begins its migration into the Northern Hemisphere. It is the transition from winter to spring in the Northern Hemisphere, when temperatures begin to increase and storm tracks move northward. In the Southern Hemisphere summer is ending and the monsoon rains are retreating northward.
Monthly Mean Temperature (1961-1990), data from the Climate Research
Unit, University of East Anglia


Monthly Mean Precipitation (1961-1990), data from the Climate Research
Unit, University of East Anglia


Temperatures
Highlights
Overall, global temperature patterns in March closely resembled those seen in February. Warmer than average temperatures in Asia continued but dissipated in much of the Middle East and Indian subcontinent. In Europe, above average temperatures in Scandinavia extended southward into much of western Europe and Africa in March. Warmer than average conditions in southern Africa and cooler-than-normal conditions in eastern Europe and Canada also resembled those from February. March brought much warmer than average temperatures to southern South America and the dissipation of the unusually warm conditions in Alaska that had been present since September 2002.
Temperature Difference from the 1961-1990 mean, with data
from NCEP Climate Prediction Center, CAMS.


Precipitation
Highlights
Across most of the tropical Pacific Ocean, ITCZ-related rainfall was heavier than normal north of the equator and was accompanied by a strip of below-normal rainfall to the south. In South America, drier-than-normal conditions continued across much of Brazil although the northeast saw above average rainfall. Above average rainfall was also observed in parts of northern Argentina and Bolivia. Precipitation totals in the Pacific northwest of the U.S. and British Columbia were above average while dry conditions were found across much of the central U.S. Nearly all of western Europe experienced below-normal precipitation for a second straight month. Storms brought above-normal precipitation to areas of the eastern Mediterranean and parts of southwest and central Asia which had been suffering from a protracted drought. Tropical cyclone Japhet produced above-normal rainfall totals in parts of Mozambique, Malawi, Zimbabwe, and Zambia, but much of the rest of southern Africa and the Great Lakes region, including most of Tanzania, were unusually dry. Unusually dry conditions returned to eastern and northern Australia and continued throughout most of New Zealand.
Precipitation Difference from 1961-1990 mean, with data
from NCEP Climate Prediction Center, CAMS-OPI.


Oceanic Conditions
Tropical Pacific: Above-normal sea surface temperatures confined to the central and western tropical Pacific continued to weaken while below-normal near-equatorial SSTs strengthened in the eastern Pacific. Above normal temperatures continued along the Pacific coast of Colombia and Central America. The El Niņo has now nearly dissipated. See the latest IRI ENSO Update for a detailed summary and outlook.
Tropical Atlantic: SSTs were slightly above-normal across most of the tropical South Atlantic in March, but temperatures remained near-normal throughout the tropical North Atlantic.
Indian Ocean: Sea surface temperatures are slightly warmer than normal across most of the Indian Ocean, particularly in the north.
Mid-latitudes: Warmer-than-normal SSTs continue to strengthen in bands along 30° north and south latitudes in the Atlantic Ocean. Above-normal SSTs strengthened quickly from February to March in the Gulf of Mexico and Caribbean Sea. Below-normal SSTs persist in the Atlantic between 40° and 50° south. Warmer-than-normal SSTs were seen in the waters of the Aleutian Islands and in a band in the North Atlantic off the southern tip of Greenland to Iceland, and the British Isles, and into the North Sea. An area of above-normal SSTs persisted in the central South Pacific south of 40° south.
Monthly Sea Surface Temperature Difference from the 1950-1979 mean,
with data from the Environmental Modeling Center, NCEP/NOAA.


Contents |
Special |
Impacts |
Climate |
Forecast
|

