|
IRI Climate Digest
April 2002
March Global Climate Summary
Climatological Background
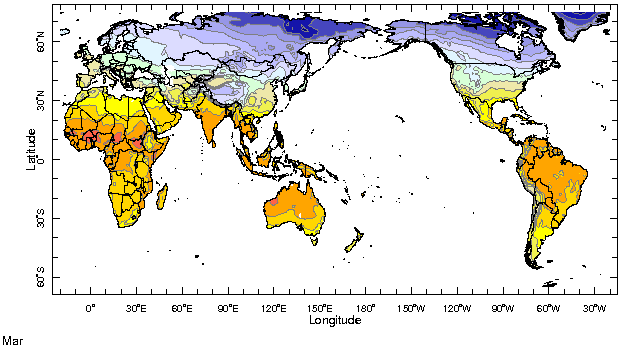
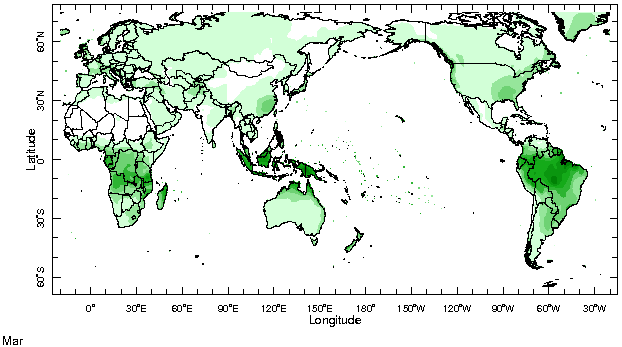
In March, the sun crosses the equator (the Equinox) and begins its migration into the Northern Hemisphere. It is the transition from winter to spring in the Northern Hemisphere, when temperatures begin to increase and storm tracks move northward. In the Southern Hemisphere summer is ending and the monsoon rains are retreating northward.
Monthly Mean Temperature (1961-1990), data from the Climate Research
Unit, University of East Anglia


Monthly Mean Precipitation (1961-1990), data from the Climate Research
Unit, University of East Anglia


Temperatures
Although somewhat weaker than those in February, the temperature anomalies in Eurasia remained well above average in March.
Europe and Asia: Temperatures across all of Eurasia were above average, particularly in Kazakhstan, central Siberia, and far eastern Russia, where temperature anomalies were completely reversed from February.
North America: In contrast to February and much of the last year, temperatures were cooler than normal over much of North America, except for western Alaska, where warm conditions persisted. Cold anomalies from January and February persisted in Northern Quebec and Labrador.
South America: Above-normal temperatures continued throughout much of northern South America while cool conditions developed in southern Argentina and Chile.
Africa: Slightly above-normal temperatures continued throughout much of the continent in March.
Australia: Temperatures in Australia were close to normal nearly everywhere. The large area of cold anomalies that had persisted for several months in western and southern Australia was confined to only a small region in March.
Temperature Difference from the 1961-1990 mean, with data
from NCEP Climate Prediction Center, CAMS.


Precipitation
The precipitation response to the emerging warm ocean temperatures can be seen in the tropical Pacific basin with excess rainfall near the dateline and in the east along the equator. Dry conditions have persisted over southern Africa, southwest Asia, Central America and have emerged over Indonesia and tropical South America east of the Andes.
Southern Africa and the Greater Horn: Rainfall deficits occurred over much of the region. Greater than average rainfall occurred in regions of Angola, Congo, northern Kenya and Uganda.
South America: Above average rainfall was observed in Ecuador and Peru. Continued rainfall along the west coast is consistent with the development of local El Niņo conditions. Deficits were observed in much of the Amazon Basin, Bolivia and eastern Brazil. Above average rainfall was observed over northern Argentina and Uruguay.
North and Central America: Dry conditions continued across much of the United States, but with some excess rainfall in the lower Mississippi basin. Dry conditions persisted also in parts of Central America including Guatemala and Panama.
East Asia: Deficits across southeastern China and Taiwan continued for a third month.
Southwest Asia: Deficits continued in Afghanistan, Pakistan and Iran.
Australia, Indonesia, and New Zealand: Rainfall deficits were observed throughout much of the region.
Precipitation Difference from 1961-1990 mean, with data
from NCEP Climate Prediction Center, CAMS-OPI.


Oceanic Conditions
Tropical Pacific: Mild surface warm anomalies have spread across the eastern and central tropical Pacific Ocean. Please see the latest IRI ENSO Update for a detailed summary and outlook.
SSTs remained above average in much of the Indian ocean, but were continuing to cool south of the equator. The warm anomalies off the west coast Africa showed decay.
Mid latitudes: Mid-latitude SSTs remained much as in previous months, with large extensive regions of warm anomalies, opposed by cold anomalies in the eastern North and South Pacific and in the higher latitudes of the southern ocean.
Monthly Sea Surface Temperature Difference from the 1950-1979 mean,
with data from the Environmental Modeling Center, NCEP/NOAA.


Contents |
Special |
Impacts |
Climate |
Forecast
|

