

 | |  |
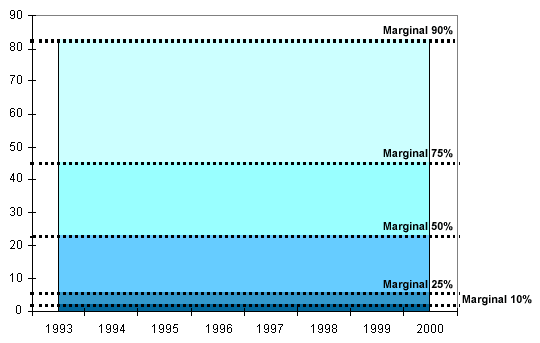
from De Souza Filho and Lall, 2002
| | |
|
|
|
|
|||
|
|
|
|
|||
|
|
|
Figure 4.1a Annual inflow (m^3/s) to Oros reservoir (in Northeastern Brazil). Information based on the long-term average flows. The probability of receiving less than a given flow is indicated by the dashed line. For example, the 25% line indicates that 25% of years receive less than the amount indicated on the y-axis, and the 90% line indicates that 90% of years receive less than the amount indicated on the y-axis. from De Souza Filho and Lall, 2002 |
|||
|
|
|
|