 |
 |
|
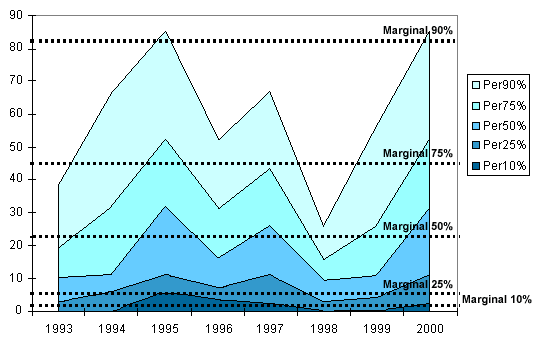
Figure 4.1b The sea-surface temperature observed in July alters the probability density function of the expected flow - that is, the likelihood of receiving any given threshold of total flow during the coming Jan-Dec. The extent to which the constant horizontal lines in (a) are perturbed by the SST information in each year 1993-2000 is shown by the solid lines in (b). The probabilities are estimated using a k-nearest neighbor model fitted to the years 1914-1992, using two SST predictors (Nino 3 and a tropical Atlantic index) measured in the July preceding the Jan-Dec flow. For example, in 1998, the model estimates that there planning strategies should assume a very high likelihood (90%) of receiving flow less than about 24 m^3/s. Without the SST information, the user would be assuming only a 50% chance of receiving flow less than about 22m^3/s (i.e. the marginal 50% level indicated by the horizontal dashed line).
from De Souza Filho and Lall, 2002 |


