|
IRI Climate Digest
March 2005
February Global Climate Summary
Climatological Background
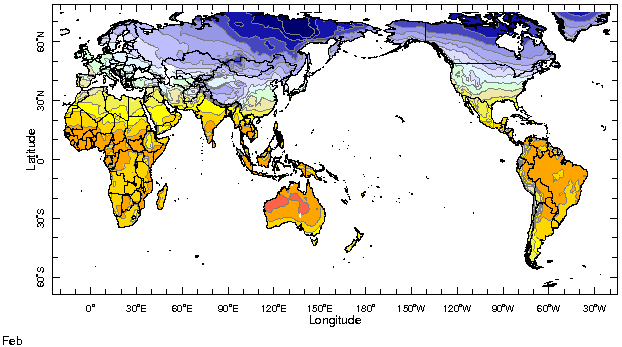
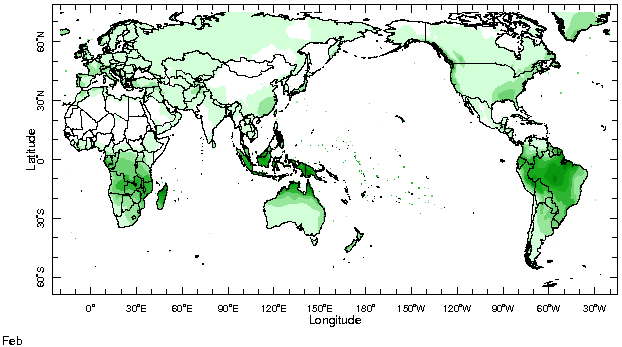
In February, the sun is retreating from its southernmost excursion (23 degrees south) on its approach toward the equator in mid-March (the equinox). It is the end of summer in the Southern Hemisphere, and the monsoon systems typically achieve their maximum intensity in Africa, Australia, Indonesia, and South America. Winter in the Northern Hemisphere generally peaks, with the north-south temperature differences beginning to drive the mid-latitude jet stream northward.
Monthly Mean Temperature (1961-1990), data from the Climate Research
Unit, University of East Anglia


Monthly Mean Precipitation (1961-1990), data from the Climate Research
Unit, University of East Anglia


Temperatures
Highlights
Surface temperatures during February were in stark contrast to those observed during January in many regions of the world. Conditions were 1-5°C below normal across much of Europe and central Asia. These same locations experienced temperatures that were up to 5°C above normal just one month earlier. The northern fringes of Europe and Asia, however, maintained their above-normal conditions with monthly temperature averages that were 1-3°C above normal. Warmer-than-average conditions returned to much of Africa during February. Temperatures across Southern Africa were approximately 1°C higher than climatology while those in the central Sahel, including portions of Niger, Nigeria, and Chad, were more than 3°C above normal. Most of North America experienced warmer-than-average conditions as well; temperature departures up to 4°C were observed in the central United States, Alaska, and western and eastern Canada. Australia and South America were among the few places that exhibited similar temperature conditions during February as those that were observed in January. Temperatures were up to 2°C above normal in most of Brazil, southern South America and northwestern Australia. The notable exception was in southeastern Australia, where record low temperatures in Victoria were blamed for a large number of livestock losses.
Temperature Difference from the 1961-1990 mean, with data
from NCEP Climate Prediction Center, CAMS.


Precipitation
Highlights
The above-normal precipitation observed in the central Pacific in February reflects an eastward shift in the South Pacific Convergence Zone (SPCZ) from its climatological position. With the exception of isolated pockets of unusually heavy rainfall, most of the Indonesian archipelago, the island groups of New Caledonia, Vanuatu, and Fiji, northern Australia, and the Philippines experienced below-normal precipitation. A low pressure system brought above-normal rainfall to the state of Victoria in southeastern Australia. Although some provinces in eastern China, including Zhejiang, Fujian, Jiangxi, and Hubei, received above-normal precipitation in February, dry conditions persisted further south in Guangdong, Guangxi, and Hainan provinces, and in much of southeast Asia. With the end of the rainy season approaching, much of southern Africa received below-normal precipitation in February; some sections of southern Africa have seen persistently dry conditions during the course of the season. Much of Europe received multiple doses of heavy winter precipitation in February which was responsible for disruptions to air and ground transportation; however, drought conditions persisted in Portugal and Spain. In the Americas, the above-normal precipitation that began in December continued in the southwestern U.S. during February, while drought conditions persisted in the Pacific Northwest. Much of Central America and the Caribbean continued to experience precipitation deficits. Sections of northern South America, including Venezuela and Colombia received above-normal precipitation which prompted flooding and landslides. Much of Paraguay and Uruguay, and sections of eastern Argentina experienced poor precipitation in February.
Precipitation Difference from 1979-1995 mean, with data
from NCEP Climate Prediction Center, CAMS-OPI.


Oceanic Conditions
Sea surface temperatures in the eastern equatorial Pacific significantly decreased with respect to the climatological normal in February and temperatures in the east-central equatorial Pacific returned to near-normal conditions. Temperatures further west generally remained above normal. See the ENSO Quick Look and the IRI ENSO Update for more information. SSTs increased strongly in the eastern tropical Indian Ocean in February, bringing anomalies above +1°C. Sea surface temperatures were above normal throughout most of the tropical Atlantic Ocean in February, particularly off the northeastern coast of South America, where +1°C anomalies represent very significant departures from normal. SSTs remained well below normal in the Intra-American Seas, and continued to cool in the South Atlantic near 30°S in February. In the extratropics, conditions in the South Pacific near 30°S and between 170°W and 120°W cooled with respect to climatology, while ocean temperatures around New Zealand increased to at least 0.5°C above normal. Warmer-than-normal conditions persisted around the coastline of southern Africa. Although there was some cooling in the waters around the Japanese Islands, ocean surface temperatures in the North Pacific changed little with respect to normal between January and February -- positive anomalies persisted in the eastern parts of the basin. With the exception of the waters just off the eastern coast of the U.S., warmer-than-normal conditions also persisted in much of the North Atlantic basin.
Monthly Sea Surface Temperature Difference from the 1971-2000 mean,
with data from the Environmental Modeling Center, NCEP/NOAA.


Contents |
Special |
Impacts |
Climate |
Forecast
|

