|
IRI Climate Digest
March 2004
February Global Climate Summary
Climatological Background
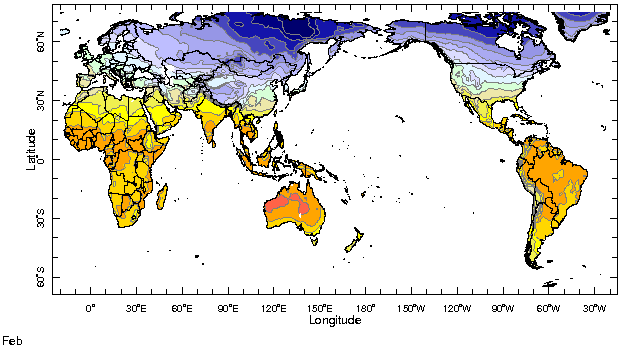
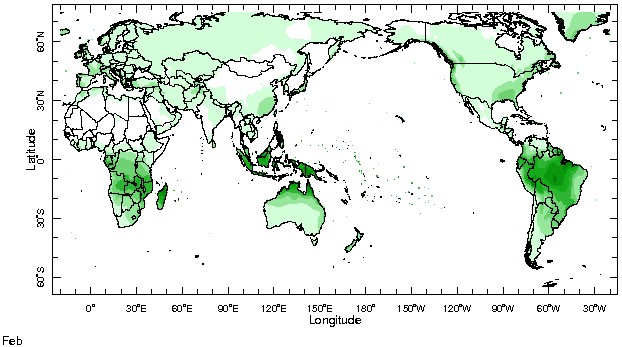
In February, the sun is retreating from its southernmost excursion (23 degrees south) on its approach toward the equator in mid-March (the equinox). It is the end of summer in the Southern Hemisphere, and the monsoon systems typically achieve their maximum intensity in Africa, Australia, Indonesia, and South America. Winter in the Northern Hemisphere generally peaks, with the north-south temperature differences beginning to drive the mid-latitude jet stream northward.
Monthly Mean Temperature (1961-1990), data from the Climate Research
Unit, University of East Anglia


Monthly Mean Precipitation (1961-1990), data from the Climate Research
Unit, University of East Anglia


Temperatures
Highlights
Warmer-than-average temperatures were recorded through much of the Northern Hemisphere during the winter months (Dec-Feb). Central and northern Asia, and Alaska saw temperatures more than 4 °C above normal in February. Notable exceptions to warm conditions were the Rocky Mountains and southern tier of the United States, which experienced slightly cooler-than-average conditions. In the summer hemisphere, southern Africa, south Australia and the southern cone of South America also saw warmer-than-average temperatures. High February temperatures over South Australia broke long-standing daily temperature records for the month at a number of stations.
Temperature Difference from the 1961-1990 mean, with data
from NCEP Climate Prediction Center, CAMS.


Precipitation
Highlights
As there has been little coherent forcing from oceanic temperatures in the equatorial Pacific Ocean, precipitation variations in February were likely associated with local sea surface temperature anomalies and/or atmospheric chaotic processes. The rainy season in southern Africa has been mixed thus far with parts of Mozambique experiencing drier-than-average conditions. The Ethiopian highlands and northern Somalia were also dry. Southwest Asia appears to be drier than normal during the peak of their annual precipitation period. New Zealand saw excess rainfall in February. Northeast Brazil also received abundant rains to start off the Feb-May rainy season.
Precipitation Difference from 1979-1995 mean, with data
from NCEP Climate Prediction Center, CAMS-OPI.


Oceanic Conditions
Tropical Pacific: Sea surface temperatures decreased slightly between January and February in the equatorial Pacific. Temperatures remain above normal in the western Pacific, near normal conditions exist east of the dateline, and slightly below normal just off the coast of Peru. See the latest IRI ENSO Update for a detailed summary and outlook.
Tropical Atlantic: The Tropical Atlantic cooled slightly during February. Stronger cooling was seen in the relatively warm waters that had developed along the African coast.
Indian Ocean: Warmer-than-normal sea surface conditions continued in a large area of the central Indian Ocean in February. The largest anomalies were located in the center of the basin just south of the equator. Below-average temperatures continued along the west coast of Australia.
Mid-latitudes: Temperatures in the North Atlantic Ocean remained above average in general, although below-normal temperatures were found in several locations along the coast of North America. Cooler-than-average temperatures developed in the subtropical South Atlantic, while a region of warm temperatures developed off the coast of Argentina. Temperatures in the central North Pacific continued to be above normal. In the extratropical South Pacific departures in the center of the basin were as large as 2.5°C.
Monthly Sea Surface Temperature Difference from the 1971-2000 mean,
with data from the Environmental Modeling Center, NCEP/NOAA.


Contents |
Special |
Impacts |
Climate |
Forecast
| 
