|
IRI Climate Digest
June 2005
May Global Climate Summary
Climatological Background
In May, the sun is well into its march north of the equator (the maximum northward location will be achieved in June at 23.6 degrees north). Surface heating of the continents are setting the stage for summer monsoonal systems or northern hemisphere warm season rains. The lack of direct solar heating in the southern hemisphere creates a north-south temperature difference which strengthens mid-latitude storm tracks with the approach of winter.
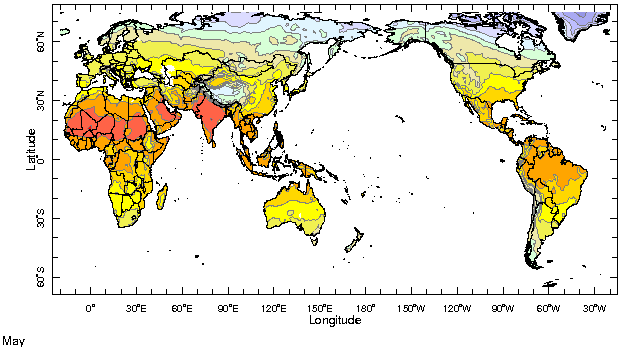
Monthly Mean Temperature (1961-1990), data from the Climate Research
Unit, University of East Anglia


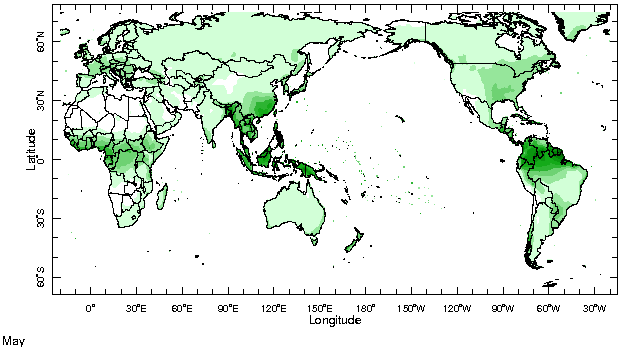
Monthly Mean Precipitation (1961-1990), data from the Climate Research
Unit, University of East Anglia


Temperatures
Highlights
Temperatures continued to be generally above average across most tropical land areas during May. Below average temperatures across eastern Australia were a welcomed relief from last month's excessive heat, while above-average temperatures shifted westward to Western Australia. Temperatures continued to be notably below average across the eastern United States, with extreme southern Argentina and Chile also experiencing cooler-than-average conditions for the month.
Temperature Difference from the 1961-1990 mean, with data
from NCEP Climate Prediction Center, CAMS.


Precipitation
Highlights
In May, the beginning of the monsoon in southern China was marked by above-normal rainfall in the southeast which resulted in considerable flood damage. Drought continued to develop in eastern Australia in May; according to a statement from the Australian Bureau of Meteorology, it has been the driest autumn since 1900 in Victoria, and South Australia. Rainfall amounts were also below average for the month in Spain and Portugal, where drought conditions have placed a considerable strain on water resources. In North America, much of the eastern U.S. and sections of eastern Canada experienced below-normal rainfall in May as well. In South America, much of Paraguay and parts of northern Argentina received heavy precipitation.
Precipitation Difference from 1979-2000 mean, with data
from NCEP Climate Prediction Center, CAMS-OPI.


Oceanic Conditions
Sea surface temperatures (SSTs) in the central equatorial Pacific remained slightly above normal during May, but are still considered to be ENSO-neutral. See the ENSO Quick Look and the IRI ENSO Update for more information. Temperatures in the tropical Atlantic Ocean continued be well above average during May, continuing the warm trend that has been seen in that region for nearly one year (Jul 2004-May 2005 SST Anomaly Animation). Specifically, positive SST anomalies of more than 1.5°C were observed northwest of the Venezuelan coast. Notably warm surface waters also remained just off the West African coast; positive anomalies of up to 3°C were observed in that region. Farther south, the cooler-than-normal conditions that first developed off the coast of Central and Southern Africa last month during April intensified last month, which may be indicative of an early arrival of the climatological cold tongue that generally develops in that region during June (Apr-Jul Climatological SSTs Animation). Conditions in the Indian Ocean changed very little from last month, remaining slightly warmer than average. Positive anomalies greater than 1°C were observed in portions of the central Indian Ocean and off the northwestern coast of Australia. In the midlatitudes, the northern Atlantic continued to be relatively warm while surface waters near the coast of the United States continued to be cool, relative to climatology. Bands of above-normal and below-normal SSTs developed along 30°N and 40°N, respectively, in the northern Pacific Ocean. SSTs in the extratropics of the southern hemisphere remained largely unchanged during May, with below-average conditions in the south Indian Ocean and above-average conditions in the south Pacific Ocean.
Monthly Sea Surface Temperature Difference from the 1971-2000 mean,
with data from the Environmental Modeling Center, NCEP/NOAA.


Contents |
Special |
Impacts |
Climate |
Forecast
|

