|
IRI Climate Digest
February 2006
January Global Climate Summary
Climatological Background
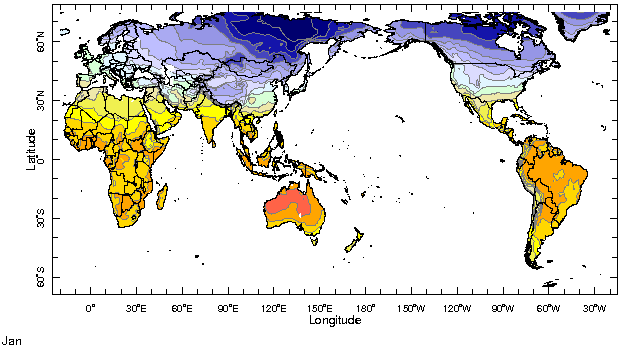
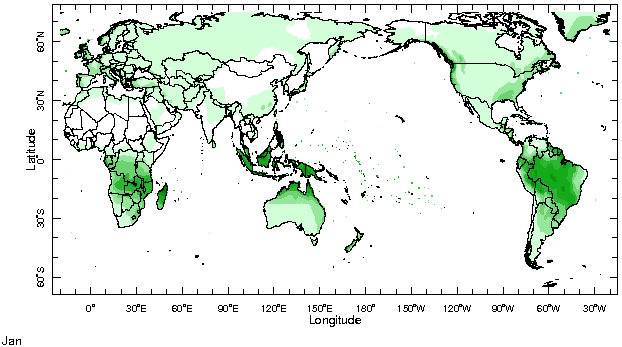
In January, mid-summer monsoon systems are usually at their peak in the Southern Hemisphere over southern Africa, Australia and Indonesia, and South America. In the Northern Hemisphere deep winter has set in, with strong north-south temperature differences driving the mid-latitude jet stream and storm systems.
Monthly Mean Temperature (1961-1990), data from the Climate Research
Unit, University of East Anglia


Monthly Mean Precipitation (1961-1990), data from the Climate Research
Unit, University of East Anglia


Temperatures
The most notable feature in the atmospheric temperature field in January was the extensive and strong cold anomalies (the strongest in excess of 10°C below normal) centered over Russia, which brought near-record low temperatures to parts of Russia, the Caucasus, and Eastern Europe and severe winter weather to Central and South Asia and Japan. In sharp contrast, January mean temperatures in North America (with the exception of Alaska) were well above normal. Temperatures were also above normal across much of Africa, particularly in West Africa. In Australia, a temperature anomaly pattern exhibiting warmer-than-normal temperatures in the east and cooler-than-normal temperatures in the west persisted and intensified for the third straight month. Warm anomalies dominated eastern Brazil, Paraguay, and northern Argentina.
Temperature Difference from the 1961-1990 mean, with data
from NCEP Climate Prediction Center, CAMS.


Precipitation
The global precipitation pattern in January exhibited some of the features one might often see with La Niņa conditions, including above-normal precipitation in much of the Maritime Continent, northern Australia, and the western Pacific, above-normal precipitation in the northwestern U.S., and above-normal precipitation in sections of Southern Africa (with the exception of Tanzania and parts of Mozambique and Madagascar). January brought above-normal precipitation to much of North Africa and also to the eastern Guinea Coast, extending into Central Africa, following upon a wet December there. Dry conditions persisted over much of Western Europe, and heavy rain and snowfall affected parts of central Asia from northern Afghanistan to western China. In Australia it was generally wet in the north and west and dry in the east. Above-normal precipitation characterized much of northern and western South America, bringing notable flooding events to Bolivia, Guyana, and Trinidad, while conditions were dry over much of Brazil.
Precipitation Difference from 1979-2000 mean, with data
from NCEP Climate Prediction Center, CAMS-OPI.


Oceanic Conditions
With a few exceptions, the ocean temperature anomaly pattern in January was similar to that in December. In the tropical Pacific, the below-normal temperatures that had developed in the east migrated into the central Pacific in January, and the maximum anomalies weakened. Warm anomalies generally persisted in the southern tropical Pacific, but weakened considerably off the east coast of Australia. The warm temperatures in the western Pacific and Maritime Continent supported above-normal precipitation in the region. The warm anomaly in the North Pacific centered near the dateline persisted and strengthened, but cold anomalies in the vicinity of the Japanese Archipelago strengthened and expanded in extent between December and January. Conditions in the Indian Ocean changed little from December, with below-normal temperatures off the west coast of Australia and warm anomalies in the Mozambique channel. Temperatures were near to above normal in most of the North Atlantic once again, but a strong "dipole" of warm and cold anomalies north and south of 40°S, respectively, developed off the east coast of South America.
Monthly Sea Surface Temperature Difference from the 1971-2000 mean,
with data from the Environmental Modeling Center, NCEP/NOAA.


Contents |
Special |
Impacts |
Climate |
Forecast
|

