|
IRI Climate Digest
February 2003
January Global Climate Summary
Climatological Background
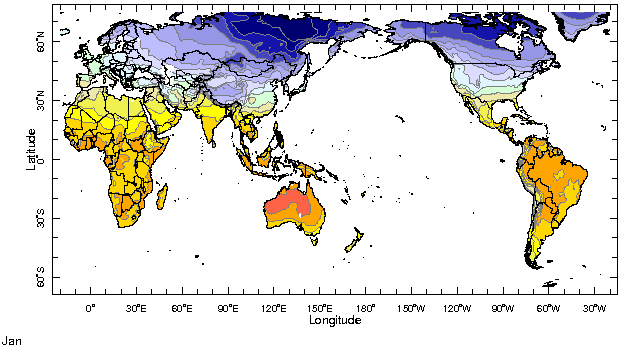
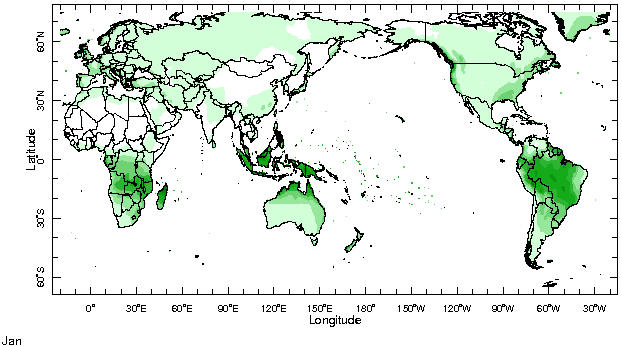
In January, mid-summer monsoon systems are usually at their peak in the Southern Hemisphere over southern Africa, Australia, Indonesia, and South America. In the Northern Hemisphere deep winter has set in, with strong north-south temperature differences driving the mid-latitude jet stream and storm systems.
Monthly Mean Temperature (1961-1990), data from the Climate Research
Unit, University of East Anglia


Monthly Mean Precipitation (1961-1990), data from the Climate Research
Unit, University of East Anglia


Temperatures
Highlights
Above-normal temperatures dominated most of the continental regions of the globe in the month of January. In eastern Australia, the continuing drought was exacerbated by warmer than normal temperatures. Southeastern Europe, Turkey and large regions of Asia experienced abnormally warm weather while cold conditions continued in Scandinavia for a fourth straight month. Much warmer than average temperatures continued in the drought-affected western United States and much of Canada, as below-normal temperatures were found in the eastern U.S. The unusually cold conditions that began in late December in Pakistan, northern India, Nepal, and Bangladesh persisted during most of the month of January.
Temperature Difference from the 1961-1990 mean, with data
from NCEP Climate Prediction Center, CAMS.


Precipitation
Highlights
Precipitation patterns typical of El Niņo episodes continued in sections of southern Africa, northern and eastern South America, eastern Australia and Indonesia.
Africa: Tropical cyclone activity brought heavy rainfall to Madagascar and northern Mozambique while much of the rest of southern Africa remained anomalously dry.
South America: The northeastern area of the continent, including Guyana, Suriname, French Guiana, and much of Brazil, experienced unusually dry conditions while anomalously wet conditions dominated in Paraguay and southern Brazil.
Australia/Indonesia: While there were some locally heavy rain events, most of this region continued to experience below average precipitation.
Northern Africa/Southern Europe: Precipitation in portions of Northern Africa and Southern Europe, including Tunisia, Italy, Macedonia, and Greece, was well above average during January.
Precipitation Difference from 1961-1990 mean, with data
from NCEP Climate Prediction Center, CAMS-OPI.


Oceanic Conditions
Tropical Pacific: Above average sea surface temperatures (SSTs) associated with El Niņo weakened throughout the central and eastern Pacific Ocean in January. SSTs that had been as much as 2.5°C above average in the eastern Pacific weakened considerably east of 120°W, leaving the largest region of above average SSTs confined to the central Pacific. The El Niņo is expected to continue to weaken over the coming months. See the latest IRI ENSO Update for a detailed summary and outlook.
Tropical Atlantic: Near-normal sea surface temperatures persisted throughout much of the tropical Atlantic, except near the Tropic of Capricorn in the South Atlantic, where above average SSTs intensified and expanded from last month.
Indian Ocean: In the eastern equatorial Indian Ocean and the seas between Indonesia and Australia, SSTs generally cooled between December and January, although SSTs of more than 1.0°C above average persisted off the northwest coast of Australia. Temperatures warmed in sections of the western Indian Ocean south of the equator; however, the above average SSTs that had existed off the coast of Somalia, Kenya, and Tanzania cooled by as much as 1.5°C between December and January.
Mid-latitudes: The patch of above average SSTs off the tip of South Africa weakened between December and January while below average temperatures in the southern Atlantic extended westward. The region of above average SSTs in the Gulf of Alaska contracted, confining itself to coastal waters, while cooler than average SSTs off the southwest coast of Greenland increased by as much as 1.0°C.
Monthly Sea Surface Temperature Difference from the 1950-1979 mean,
with data from the Environmental Modeling Center, NCEP/NOAA.


Contents |
Special |
Impacts |
Climate |
Forecast
| 
