|
IRI Climate Digest
December 2004
November Global Climate Summary
Climatological Background
During November, the northern hemisphere mid-latitude storm tracks increase in strength, while monsoon systems in South Africa, Australia, and South America expand southward following the maximum solar heating. Tropical storm activity decreases in the North Atlantic, the North Pacific, and northern Indian Oceans.
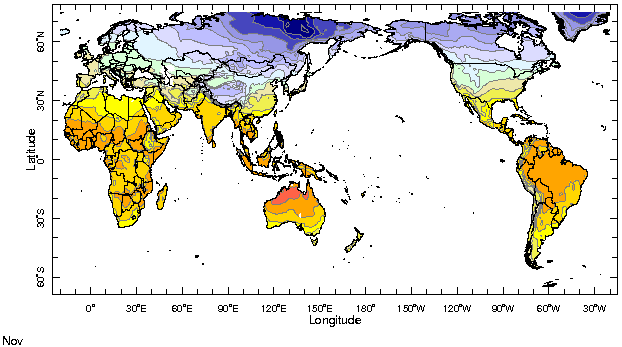
Monthly Mean Temperature (1961-1990), data from the Climate Research
Unit, University of East Anglia

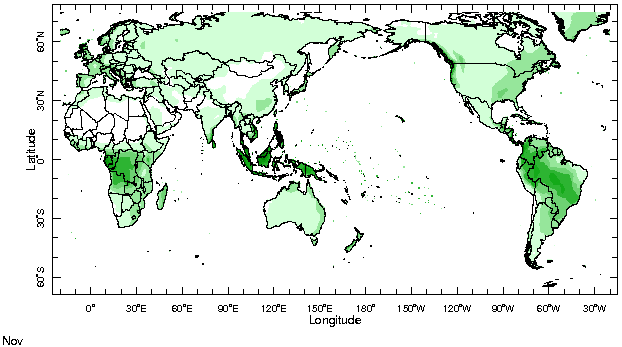
Monthly Mean Precipitation (1961-1990), data from the Climate Research
Unit, University of East Anglia

Temperatures
Highlights
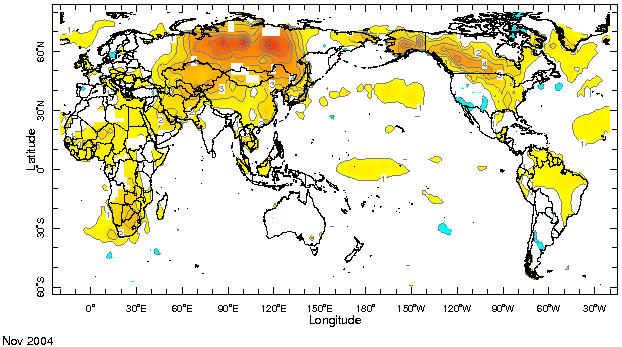
A switch to positive temperature anomalies characterized the high latitudes of the northern hemisphere. Across Siberia from 60°E to 150°E temperatures were up to 7°C above normal and accompanied by southerly flow at the surface. Warmer-than-normal conditions across the high latitudes of North America followed the ridge in sea level pressure in the Gulf of Alaska. Temperatures were also above normal at subtropical latitudes across Asia, with anomalies of 2° to 4°C from the Middle East to China, as well as across southern and western Africa, the eastern United States and tropical Brazil. As a consequence of the northerly winds blowing cold air from polar latitudes, temperatures across western Europe decreased with respect to the previous month, to below or near normal. Temperatures were also below normal in the south-central U.S. and into Mexico. Argentina and Paraguay experienced below-normal temperatures in association with above-average precipitation.
Temperature Difference from the 1961-1990 mean, with data
from NCEP Climate Prediction Center, CAMS.

Precipitation
Highlights
Some of the precipitation anomalies generally associated with a warm ENSO event were present during November as rainfall was suppressed across South and Southeast Asia, over the tropical Americas, and into the Atlantic Intertropical Convergence Zone. However, deep convection and the relaxation of the surface easterly winds that accompany the coupling between ocean and atmosphere typical of a warm ENSO event had not yet established themselves east of the dateline in the tropical Pacific. Despite the predominantly drier-than-average conditions over Southeast Asia, the northern Philippines experienced above-average precipitation associated with the passage of tropical cyclones. Large positive rainfall anomalies were most conspicuous at low latitudes in the central Indian Ocean, and in the western Pacific. Parts of the Greater Horn of Africa, most notably Somalia, also received above-average rainfall.
Precipitation Difference from 1979-1995 mean, with data
from NCEP Climate Prediction Center, CAMS-OPI.


Oceanic Conditions
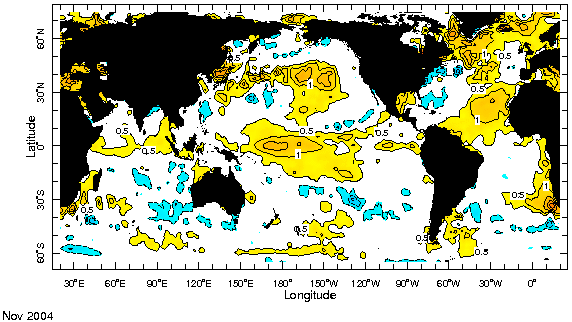
Warmer-than-average surface conditions prevailed in the equatorial Indian and Pacific Oceans. In the tropical Pacific they extended from east of Papua New Guinea to the west coast of South America. See the latest IRI ENSO Update for a detailed summary and outlook for the tropical Pacific. Positive anomalies persisted in the extratropical latitudes of the northern hemisphere, in the region of the Kuroshio Extension at 40°N in the North Pacific, and across much of the North Atlantic, including the Labrador and Greenland-Iceland-Norwegian Seas. Warm conditions strengthened in the eastern tropical North Atlantic, off the coast of West Africa, and along the southwestern coast of Africa. Patches of negative anomalies could be seen across the southern subtropical latitudes, around 30°S.
Monthly Sea Surface Temperature Difference from the 1971-2000 mean,
with data from the Environmental Modeling Center, NCEP/NOAA.

Contents |
Special |
Impacts |
Climate |
Forecast
| 