|
IRI Climate Digest
April 2005
March Global Climate Summary
Climatological Background
In March, the sun crosses the equator (the Equinox) and begins its migration into the Northern Hemisphere. It is the transition from winter to spring in the Northern Hemisphere, when temperatures begin to increase and storm tracks move northward. In the Southern Hemisphere summer is ending and the monsoon rains are retreating northward.
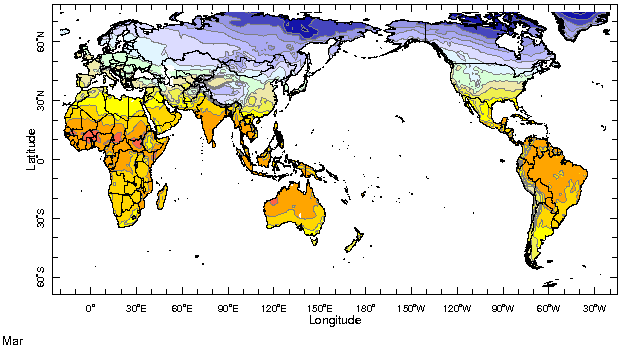
Monthly Mean Temperature (1961-1990), data from the Climate Research
Unit, University of East Anglia

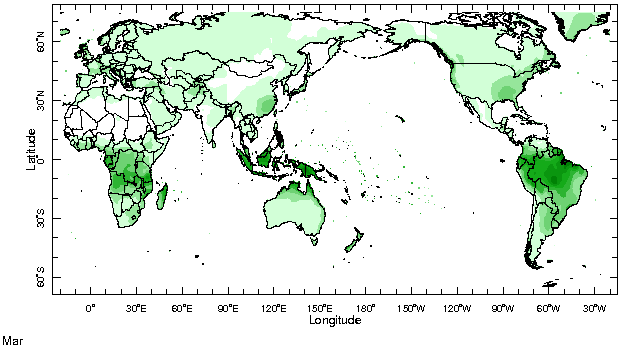
Monthly Mean Precipitation (1961-1990), data from the Climate Research
Unit, University of East Anglia

Temperatures
Highlights
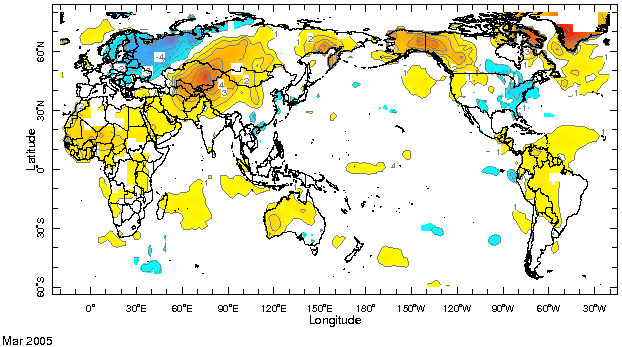
In the tropics, normal to above-normal air temperatures prevailed. Between February and March, marked cooling with respect to normal characterized the mid-latitudes of South America and eastern North America. Temperatures warmed in southern Europe and cooled with respect to normal in northern Europe, in a see-saw pattern consistent with the prevalence of the negative phase of the North Atlantic Oscillation. Temperatures in central and southwestern Asia, from the Ukraine into central Siberia, and south to Afghanistan, Iran, and Pakistan, warmed significantly compared to February.
Temperature Difference from the 1961-1990 mean, with data
from NCEP Climate Prediction Center, CAMS.

Precipitation
Highlights
In March, the equatorial anomaly in the western Pacific Ocean that had dominated previous months considerably decreased in strength. Positive precipitation anomalies across the Indonesian archipelago, from southern Sumatra to Irian Jaya, and into northwestern Australia, broke the dry pattern that has characterized the better part of the local rainy season. While anomalies in the monsoon regions of southern Africa and South America were still predominantly negative, they were much less spatially coherent in character. Patches of positive anomalies appeared in southeastern Africa (Zimbabwe and Mozambique), and in South America (coastal Peru and central Brazil). However, seasonal anomalies for January-March still tell a story of widespread drought, for tropical South America, Southeast Asia and southeastern Africa, though not for southwestern Africa.
Precipitation Difference from 1979-1995 mean, with data
from NCEP Climate Prediction Center, CAMS-OPI.


Oceanic Conditions
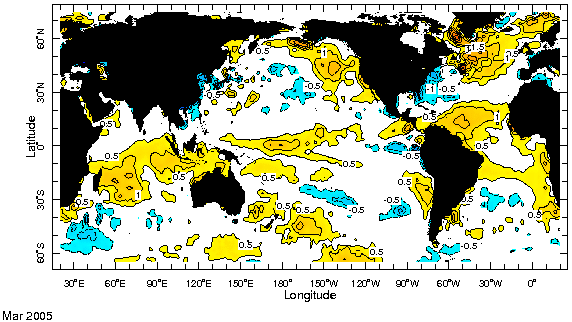
The tropical oceans, including the equatorial and southern Indian Ocean, the western and central equatorial Pacific Ocean, and the tropical North Atlantic Ocean, were warmer than average in March, with little or no change from the previous month. See the ENSO Quick Look and the IRI ENSO Update for more information. The extratropical oceans, around 30°S and 30°N, cooled slightly compared to the previous month. In the North Atlantic a tripole structure prevailed, with cool subtropics sandwiched between warm tropics and high latitudes, a pattern typically associated with the negative phase of the North Atlantic Oscillation.
Monthly Sea Surface Temperature Difference from the 1971-2000 mean,
with data from the Environmental Modeling Center, NCEP/NOAA.

Contents |
Special |
Impacts |
Climate |
Forecast
|
