Canonical Correlation Analysis for Ingrid
CCA is a commonly used tool in climate sciences to measure the linear relationship between two multidimensional variables. It also allows model building for forecasting. Being very similar to the Singular Value Decomposition (SVD) approach that Ingrid already supports, it made sense to develop a CCA for Ingrid, using its SVD. Here are presented three case studies illustrating how CCA analysis as well as model building and forecasting can be performed in Ingrid, prior to the set up of an Ingrid CCA function of its own. |
The method |
|---|
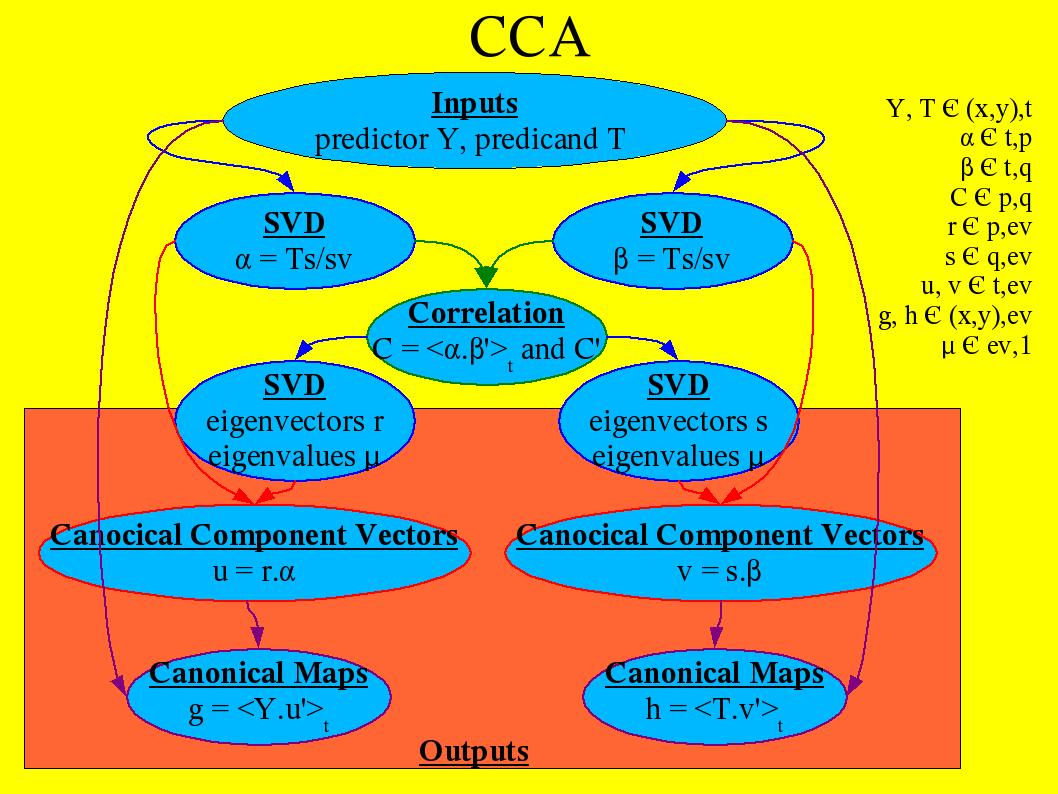
The main idea of CCA is to look for a vectors basis in which the correlation between the Principal Components (PCs) of two variables is optimal. Ingrid SVD computes PCs and, without going into much writen details, Figure 1 shows a flowchart of a CCA based on Ingrid SVD. |
 |
Figure 1 - Flowchart of CCA method. Some notations are from Ingrid SVD |
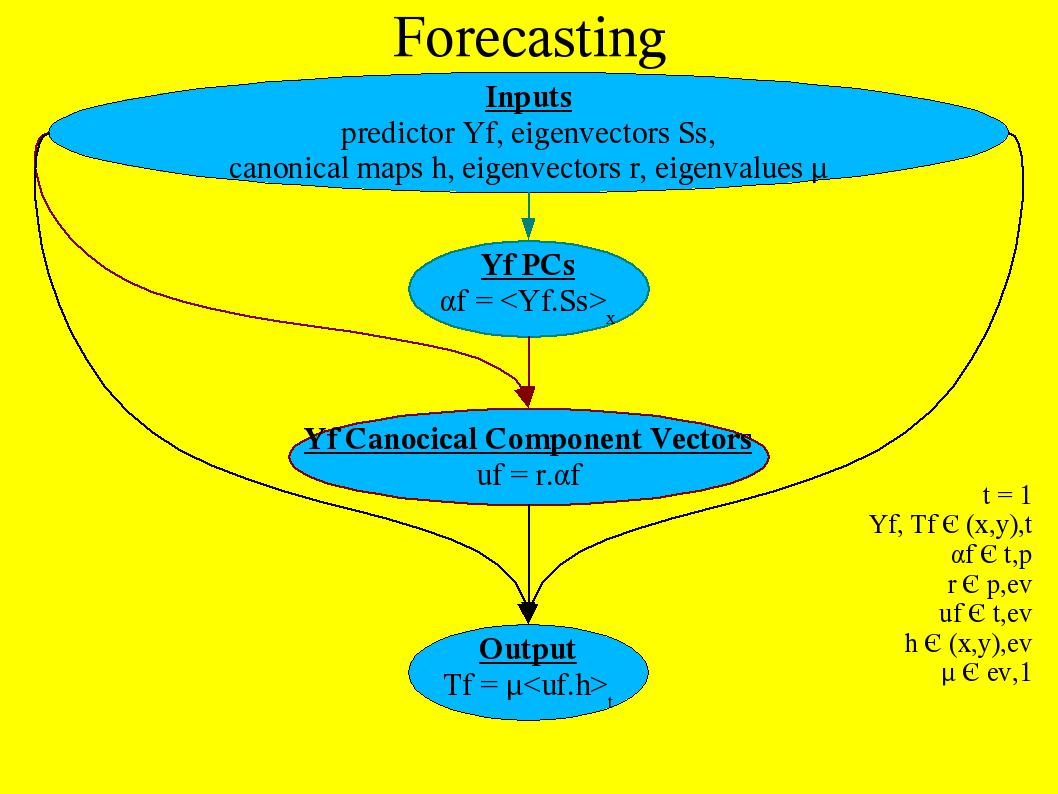
The analysis needs a method to determine p and q, which are the numbers of PCs kept respectively of the predictor and the predicand. General Cross Validation (GCV) might be a way to choose the truncation. With the CCA outputs and a specific predictor at a different time of the time spanned to create the CCA, a prediction can be made, as Figure 2 shows. |
 |
Figure 2 - Flowchart of CCA forecast. Ss are the eigenvectors from the SVD of the original predictor Y |
There is also a need to evaluate the forecast skill. Once again GCV might be the tool to provide it. |
Forecasting DJF Philippines rainfall |
|---|
Forecasting seasonal rainfall from seasonal Sea Surface Temperature (SST) is the first motivation for developing CCA for Ingrid and the Data Library as we would like soon users being able to do it for Nordeste Brazil region and the Philippines. To do so we look at correlations between fourty years of SST of tropical Indian and Pacific oceans, between 30°S and 30°N, and Philippines rainfall. More precisely, the CCA is performed between September-October-November (SON) yearly mean SST and the following December-January-February (DJF) rainfall in the Philippines, from 1961 to 2000 and in terms of anomalies in regards to those fourty-year seasonnal means. I arbitrarily chose to keep fifteen modes of the predictor and ten modes of the predicand. SON 2001 SST is then used to predict the following DJF 2001-2002 rainfall. Figure 3 puts together the actual observed rainfall anomaly and the forecast. |

 |
 |
Figure 3 - 2001-2002 DJF precipitation anomaly. Left: from WCRP; right: from CCA between WCRP and SST from NOAA NCDC ERSST version2 (Improved extended reconstructed global sea surface temperature data based on COADS data) |
I have not yet a skill to estimate the forecast to propose but one can see that the forecast is not totally absurd and that it caught the two biggest features of rainfall on the east coast, the northern one expanding way too much to its surroundigs while the southern one not enough. |
Forecasting Northern Wintertime 500 mb Height anomaly |
|---|
This time the predictor and predicand are respectively 1961-2001 DJF Pacific ocean SST north of 10°N and an hemispheric 500 mb height field (north of 20°). The prediction is performed on the 2000-2001 DJF season and the result is shown in Figrue 4. |
 |
 |
 |
Figure 4 - 2000-2001 DJF 500 mb height anomaly. Left: from NOAA NCEP-NCAR CDAS-1 (Climate Data Assimilation System I; NCEP-NCAR Reanalysis Project); right: from CCA between CDAS-1 and SST from NOAA NCDC ERSST version2 (Improved extended reconstructed global sea surface temperature data based on COADS data) |
Once again the big picture was caught by the analysis. I wouldn't mind too much about what happens close to the pole: to start the projection is not great for this region. |
Forecasting MAM Nordeste rainfall |
|---|
In this case, ENSO in the equatorial Pacific ocean on one hand and the variability of the tropical Atlantic ocean on the other hand drive variability in SST in those regions which we expect to drive the rainfall in the Nordeste region of Brazil. Because this case didn't work out right away as well as the Philippines, I gave a little more try and the results illustrate, I guess, the weakness and strength of CCA as a predicting model. What is expected is that cold anomalies in the Eastern Pacific ocean would induce wetter conditions in Nordeste as well as Northern tropical Atlantic ocean SST warmer than its Southern counterpart. |
A first study considers Pacific and Atlantic contributions separately. The Nordeste box is defined as follow: 37.5°W to 50°W and 10°S to 2.5°N. The Pacific is confined between 20°S and 20°N and the Atlantic between 30°S and 30°N. Figure 5 shows the results. The CCA is computed through the years 1961 to 2000 and the prediction is made with MAM 2001. |


 |
 |
Figure 5 - 2001 MAM precipitation anomaly. From left to right: from WCRP; from CCA between WCRP and Pacific SST; from CCA between WCRP and Atlantic SST from NOAA NCDC ERSST version2 (Improved extended reconstructed global sea surface temperature data based on COADS data) |
Here again the pattern of the two predictions are similar to what was observed, but with siginificant weak values (even though it is not very much readable on the figures). The fact is I splitted the two contributions because doing the CCA with both oceans together didn't give good results. A possible explaination is that in MAM 2001, East equatorial Pacific and Tropical Atlantic SST contributions were expected to be opposite. However, the results when performing the two CCAs are similar. Those contradictions are highlit here just to point out that CCA might not always be able to be efficient even in highly predictable configurations. |
Then I tried using another precipitation dataset where the precipitation is available over oceans as well. The Nordeste box definition remained the same, and the Pacific and Atlantic oceans were taken as a whole (between 20°S and 20°N). Because of a shorter dataset, the training is now computing on years through 1979 to 1998 and the prediction made in year 1999. Figure 6 shows the results.

 |
 |
Figure 6 - 1999 MAM precipitation anomaly. Left: from NOAA NCEP CPC CAMS_OPI (Climate Anomaly Monitoring System-Outgoing longwave radiation Precipitation Index); from CCA between CAMS_OPI and equatorial SST from NOAA NCDC ERSST version2 (Improved extended reconstructed global sea surface temperature data based on COADS data) |
Here we can see a decent result where the ITCZ seem to be about the right place even though too much widespread. Note that the resolution is coarse and that in that case, CCA might be more able to catch the big scale phenomena rather than smallest ones shown in the previous study where other factors might impact the precipitation. |
Reference |
|---|
Barnett, T. P., and R. Preisendorfer, 1987: Origins and Levels of Monthly and Seasonal Forecast Skill for United States Surface Air Temperatures Determined by Canonical Correlation Analysis. Monthly Weather Review. |
Wallace J. M., C. Smith and C. S. Bretherton, 1992: Singular Value Decomposition of Wintertime Sea Surface Temperature and 500-mb Height Anomalies. Journal of Climate. |
|
|


