IRI ENSO Forecast
IRI Technical ENSO Update
Published: March 19, 2021
Note: The SST anomalies cited below refer to the OISSTv2 SST data set, and not ERSSTv5. OISSTv2 is often used for real-time analysis and model initialization, while ERSSTv5 is used for retrospective official ENSO diagnosis because it is more homogeneous over time, allowing for more accurate comparisons among ENSO events that are years apart. During ENSO events, OISSTv2 often shows stronger anomalies than ERSSTv5, and during very strong events the two datasets may differ by as much as 0.5 C. Additionally, the ERSSTv5 may tend to be cooler than OISSTv2, because ERSSTv5 is expressed relative to a base period that is updated every 5 years, while the base period of OISSTv2 is updated every 10 years and so, half of the time, is based on a slightly older period and does not account as much for the slow warming trend in the tropical Pacific SST. In February 2021, both datasets were updated using the 1991-2020 climatology period.
Recent and Current Conditions
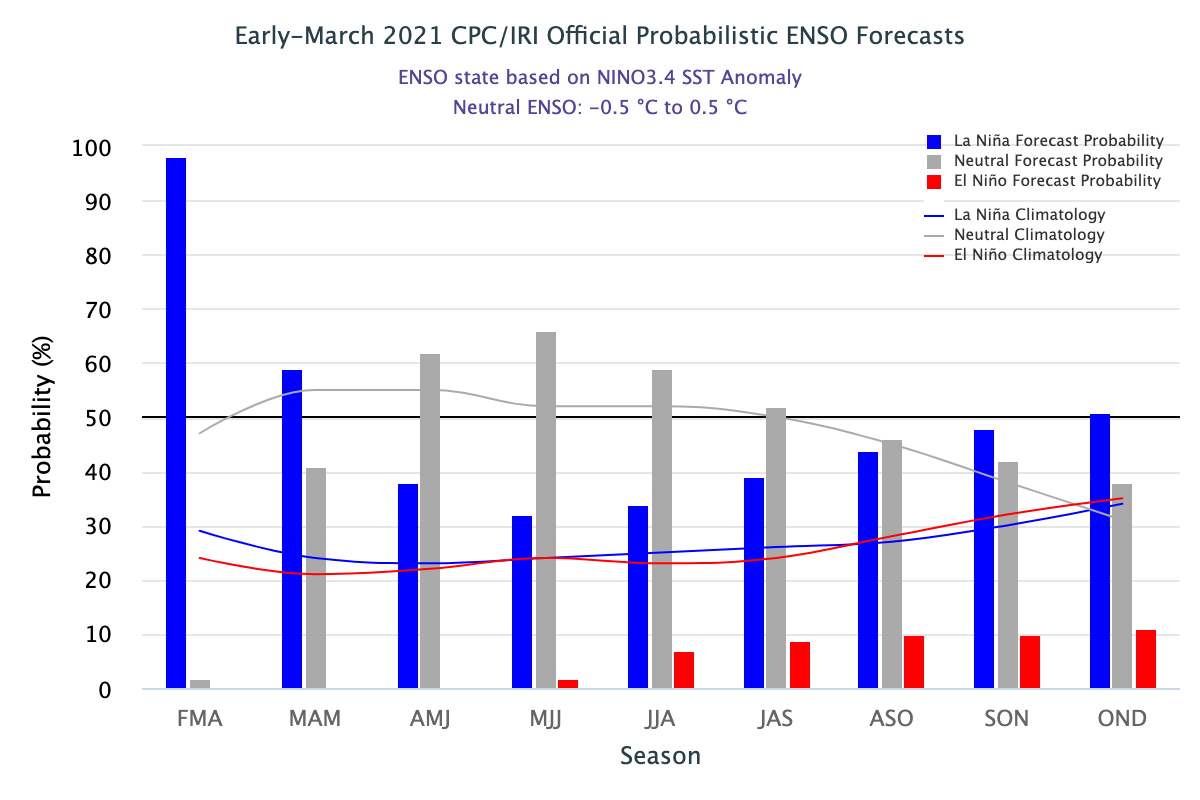
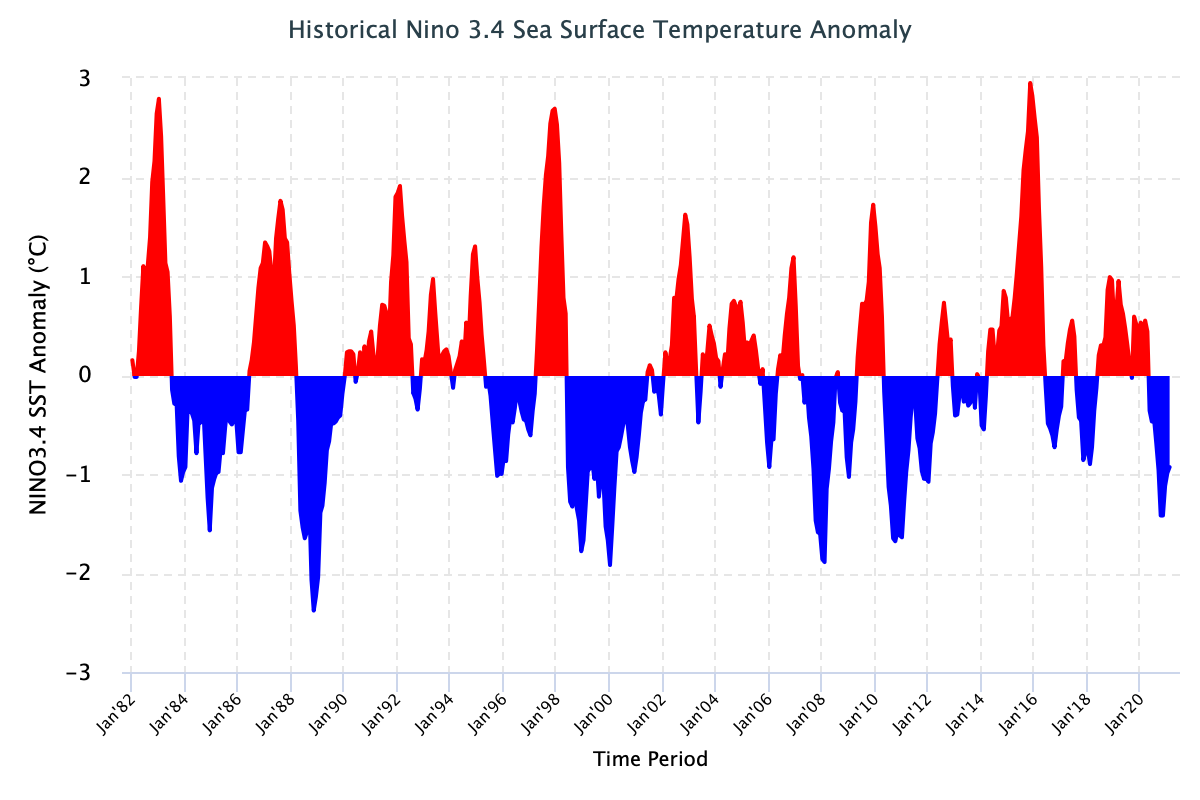
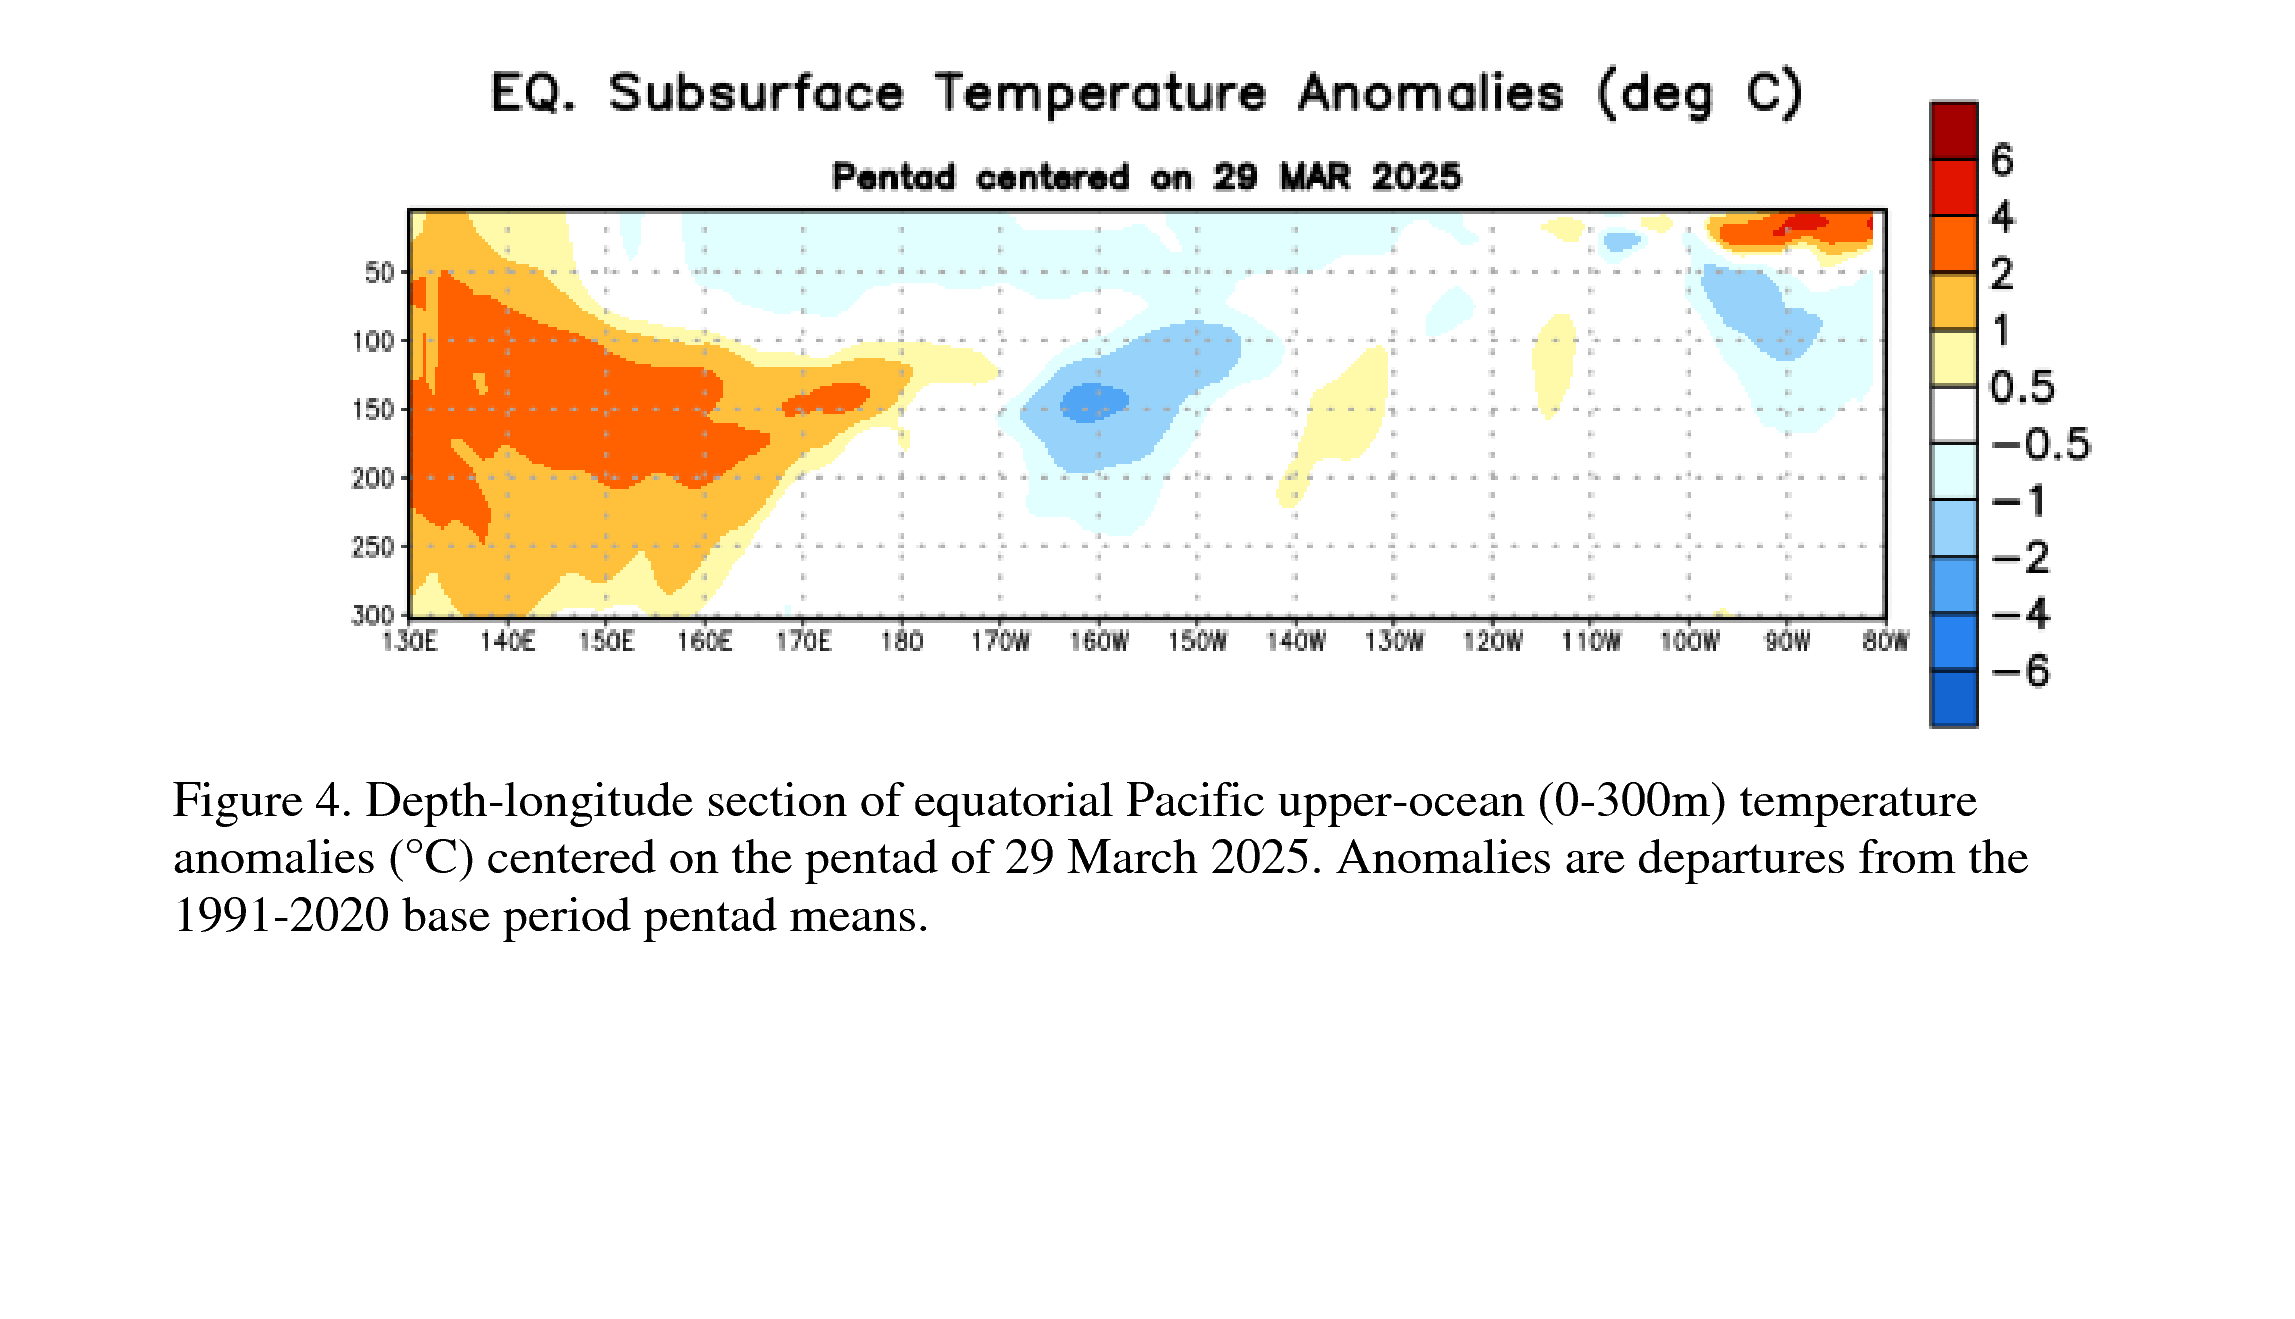
In mid-March 2021, SSTs are just slightly below average in the NINO3.4 region, although the tropical Pacific has exhibited La Niña conditions since August 2020. The SST anomaly for NINO3.4 during the Dec-Feb season was -1.01 C, and for the month of February it was -0.93 C, suggesting a continued, but weakening La Niña conditions that peaked in late October/early November 2020. The IRI’s definition of El Niño, like NOAA/Climate Prediction Center’s, requires that the SST anomaly in the NINO3.4 region (5S-5N; 170W-120W) exceed 0.5 C. Similarly, for La Niña, the anomaly must be -0.5 C or less. The climatological probabilities for La Niña, neutral, and El Niño conditions vary seasonally, and are shown in a table at the bottom of this page for each 3-month season. The most recent weekly anomaly in the NINO3.4 region was -0.3 C, which is in the ENSO-neutral range; however, there exists discernible week-to-week variability in the strength of the SST anomalies, and again the 3-month average NINO3.4 index has not yet become ENSO-neutral. Many of the key atmospheric variables, indicative of La Niña conditions, have also weakened discernibly over the past month, such as the traditional and equatorial Southern Oscillation Indices, which have dropped considerably but remain positive. The low-level easterly wind anomalies are weakened further in February and are visible now mainly in the western Pacific; upper level wind anomalies remain westerly across much of the tropical Pacific but are less coherent. Anomalously dry conditions that were observed over the west-central part of the basin, continue to weaken and break up, as have the wetter than normal anomalies over the Maritime Continent. For the ocean, subsurface temperature anomalies in the central and eastern equatorial Pacific are quite reduced in mid-March. Warm sub-surface temperature anomalies (deepened thermocline anomalies) have been building in the western Pacific, and they are now moving eastward along the equator. In summary, current monthly conditions still indicate a borderline moderate La Niña that is weakening. A La Niña advisory remains in effect.
Expected Conditions
Note – Only models that produce a new ENSO prediction every month are considered in this statement.
What is the outlook for the ENSO status going forward? The most recent official diagnosis and outlook was issued approximately one week ago in the NOAA/Climate Prediction Center ENSO Diagnostic Discussion, produced jointly by CPC and IRI; it states that La Niña conditions are present and are most likely to continue through boreal winter, with a 98% chance for Feb-Apr, falling to 59% for Mar-May. A transition to neutral conditions during the Apr-Jun season is suggested with a 62% probability.
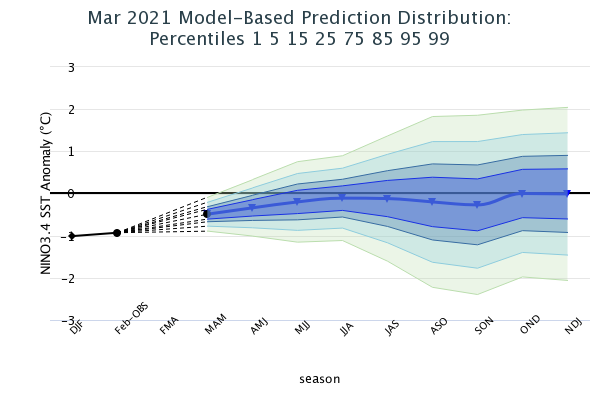
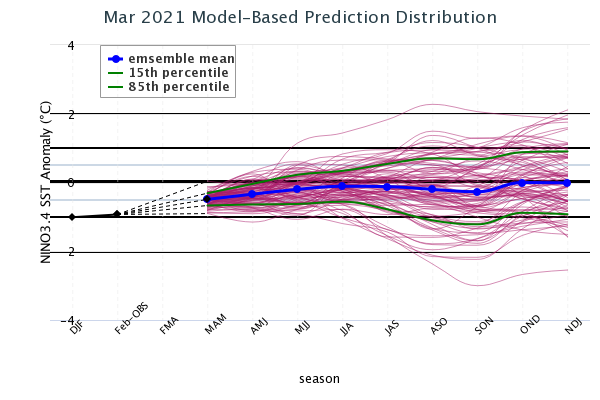
The latest set of model ENSO predictions from mid-March is now available in the IRI/CPC ENSO prediction plume. These are used to assess the probabilities of the three possible ENSO conditions by using the average value of the NINO3.4 SST anomaly predictions from all models on the plume, equally weighted. A standard Gaussian error is imposed over that average forecast, and its width is determined by an estimate of overall expected model skill for the season of the year and the lead time. Higher skill results in a relatively narrower error distribution, while low skill results in an error distribution with width approaching that of the historical observed distribution. Using this method, chances for La Niña are 54% for the Mar-May season, while chances for ENSO-neutral are 46%. ENSO-neutral conditions become most likely by Apr-Jun, starting at 66%. Later in the year, the collection of models suggests that the cool side of ENSO-neutral is most likely. However, it is typically difficult to accurately foresee ENSO conditions for the latter part of the year through the boreal spring prediction barrier. El Niño probabilities are less than 10% until Jun-Aug, then rise to around 20% during boreal fall. A plot of the probabilities generated from this most recent IRI/CPC ENSO prediction plume using the multi-model mean and the Gaussian standard error method summarizes the model consensus out to about 10 months into the future.
Caution is advised in interpreting the forecast distribution from the Gaussian standard error as the actual probabilities, due to differing biases and performance of the different models. In particular, this approach considers only the mean of the predictions, and not the total range across the models, nor the ensemble range within individual models. At longer leads, the skill of the models degrades, and uncertainty in skill must be convolved with the uncertainties from initial conditions and differing model physics, which leads to more climatological probabilities in the long-lead ENSO Outlook than might be suggested by the suite of models. Furthermore, the expected skill of one model versus another has not been established using uniform validation procedures, which may cause a difference in the true probability distribution.
In summary, the probabilities derived from the models on the IRI/CPC plume describe a very slim chance for El Niño conditions throughout most of the forecast period, and a preference for La Niña conditions relative to neutral conditions during the current season, Mar-May. By the Apr-Jun season, neutral becomes the more likely outcome through the remaining forecast periods, through the forecasts favor the cool side of the ENSO-neutral category. This scenario has been stable over the last couple months of forecasts.
A caution regarding the model-based ENSO plume predictions released mid-month, is that factors such as known specific model biases and recent changes in the tropical Pacific that the models may have missed, are not considered. This approach is purely objective. Those issues are taken into account in the official outlooks, which are generated and issued early in the month by CPC and IRI, and which will include some human judgment in combination with the model guidance.
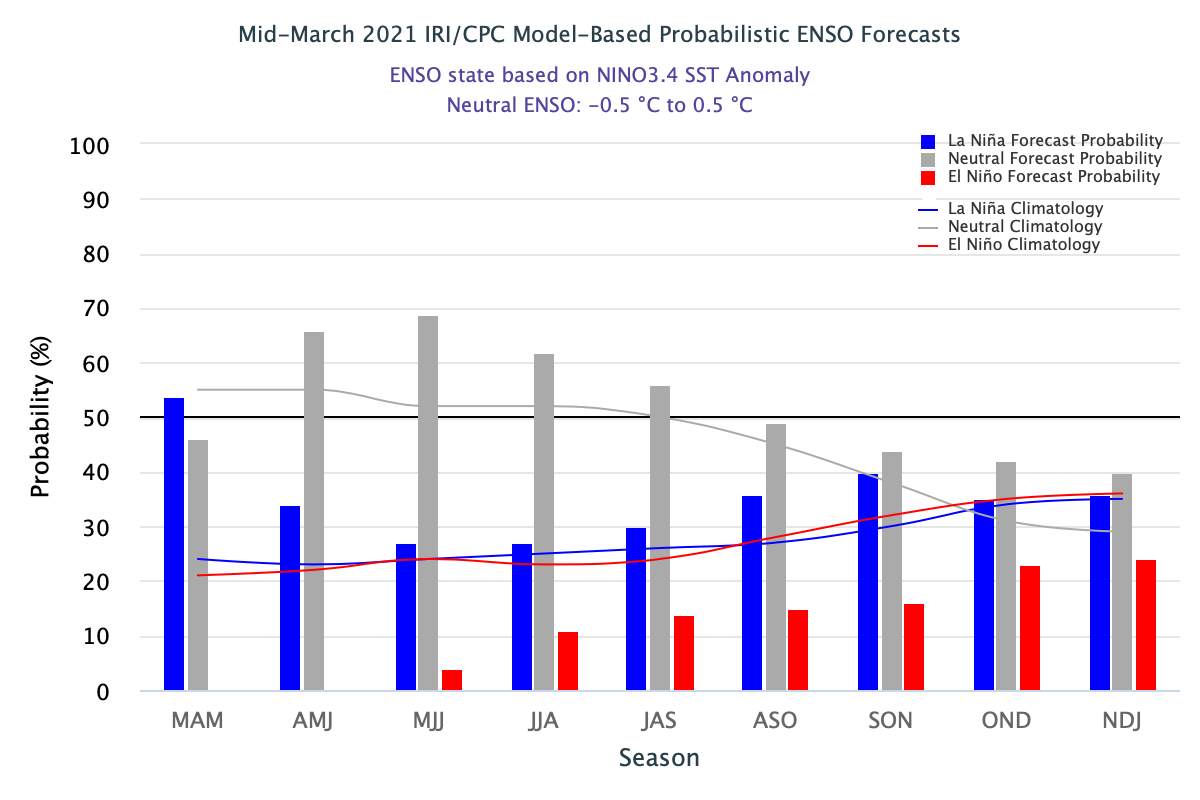
IRI/CPC Mid-Month Model-Based ENSO Forecast Probabilities
| Season |
La Niña |
Neutral |
El Niño |
| MAM 2021 |
54% |
46% |
0% |
| AMJ 2021 |
34% |
66% |
0% |
| MJJ 2021 |
27% |
69% |
4% |
| JJA 2021 |
27% |
62% |
11% |
| JAS 2021 |
30% |
56% |
14% |
| ASO 2021 |
36% |
49% |
15% |
| SON 2021 |
40% |
44% |
16% |
| OND 2021 |
35% |
42% |
23% |
| NDJ 2021 |
36% |
40% |
24% |