Top Stories
A Wetter Sahel, But will it Last?
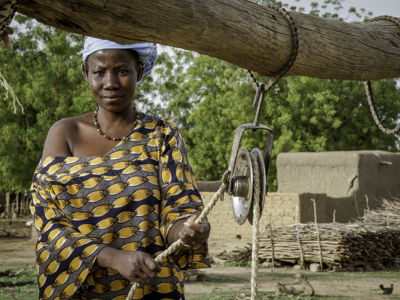
In the 1970s and 1980s, people living in Africa's Sahel were hit by a series of persistent droughts and recurring famines. Since the mid-1980s, average rainfall has increased in the region, and many have been able to rebuild their livelihoods. A new paper elegantly explains for the first time the mechanism behind the Sahel's past and present climate trends, as well as projected ones. Such an understanding is critical for developing sound adaptation policies in a region that remains highly vulnerable to climate change and year-to-year variability.
A Healthy CollaborationThe IRI recently renewed an agreement with the World Health Organization to be a collaborative center. Research scientist and center director Madeleine Thomson talks about past successes and future research directions with M.A. in Climate and Society student Elisabeth Gawthrop.
Published & Noteworthy
|
|
|
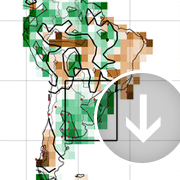
Rainfall in South Eastern South America substantially increased in the latter half of the 20th century--in some cases, by an average of 50 mm/month from 1960-1999. As a result, the region's agricultural production has also increased dramatically.
A new study based on climate models shows that ozone depletion, i.e., the ozone hole, was a major cause of this rainfall increase. In fact, the results suggest that the impact it had on rainfall in the region was as large as, if not larger than, the impact of increased greenhouse gases over the same time period.
"Polar ozone loss consistently produced a southward shift of the jet stream," says IRI's Paula Gonzalez, one of the study's coauthors. "This directly affected the winds at lower latitudes, contributing to increased precipitation across the region."
As stratospheric ozone levels recover, rainfall could stabilize or even decrease, which could have profound effects on the region's economic and agricultural strategies.
|
|
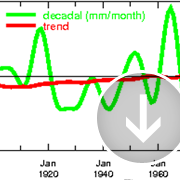
The "Time Scales Map Room," a web-based tool developed by the IRI, can shed light on the characteristics of historical temperature and precipitation variability for any part of the world, at the click of a mouse button.
How much of an influence have long term climate trends had on temperatures in the Southwest U.S., for example? What about the role of climate patterns that play out over decades, or, in the case of El Niño and La Niña, every few years?
With the Time Scales Map Room, users can examine global or regional maps that show relative contributions to the observed climate of century-scale trends, as well as variability on decadal and interannual time scales.
"This is a powerful tool that can help people clarify the potential utility of different types of climate information in the context of anticipated risks," says IRI's Arthur Greene, who helped create the maproom with Lisa Goddard and Rémi Cousin. They wrote a brief paper in Eos that detailed the tool's purpose and function.
|
|
|
|
|