Cluster analysis of malaria data in Sri Lanka, from 1972 to 2003
A cluster analysis on the total number of malaria cases reported may help detect structures in the spatial and time variability of the cases. It is a first step to try to relate the disease variability to known or yet to be known other climate phenomenons variability
The dataset
The data are a set of time series from January 1972 to December 2003 for each district of Sri Lanka. It appears that half of the dataset time series have only half of the time series complete or less as Figure 1 shows.
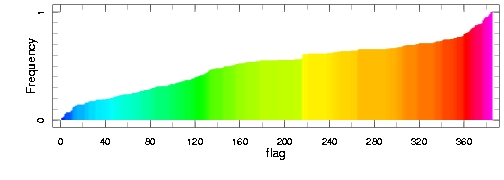
Figure 1 - Cumulative frequency of number of months with data.
A closer look at the time series show that there seems to be two subsets of data within this dataset. Figure 2 shows a first set running almost continuously from Jan 1972 to Dec 1989 and the other one from Jan 1990 to Dec 2003.
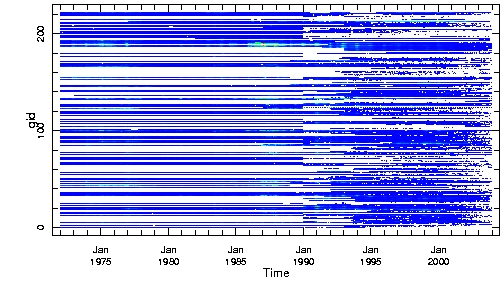
Figure 2 - Data time series by district (IDs from 0 to 222).
Since it doesn't seem fair to compare data from time series that occured at different periods, the temporal subsets will then be analysed separately, in addition to the whole time series study.
Filling the gaps
In order to perform a cluster analysis, which suffers no gaps in the dataset, the gaps are filled via an SVD reconstruction of the time series, after having gotten rid of the districts presenting only data for half of the total time or less. Figure 3 shows the difference between the reconstructed and the original for each three periods (1972-1990, 1990-2003, 1972-2003).
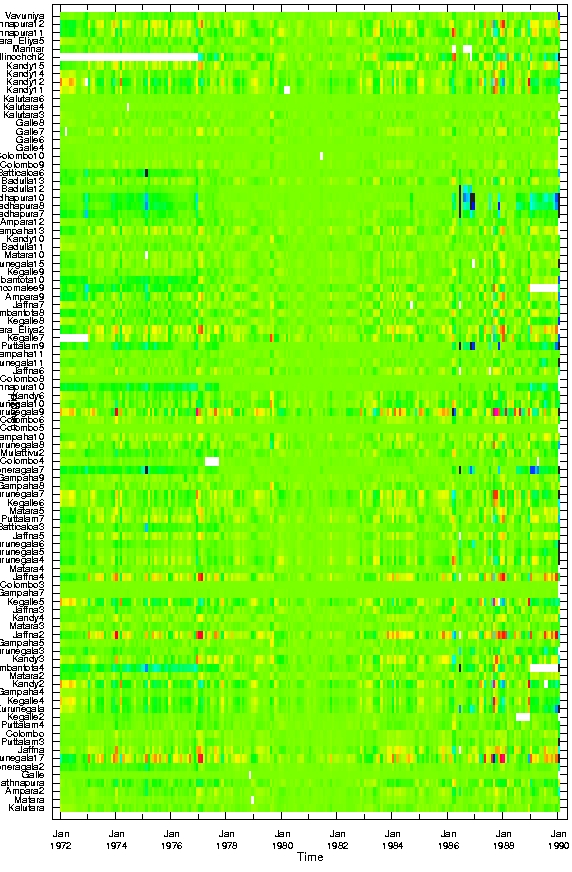


Figure 3 - Difference between reconstructed and original time series (Ori-Rec) White shows the original gaps. The reconstructed version has troubles reaching the high extreme values (hence differences in districts with no gaps). From left to right: 1972-1990, 1990-2003 and 1972-2003.
Being happy with the reconstructed time series, a cluster analysis can be performed.
A cluster analysis
The analysis is a k-mean analysis with 5 clusters. The original cluster centers are deduced from a SVD analysis. Figure 3 shows the result for the three time periods.
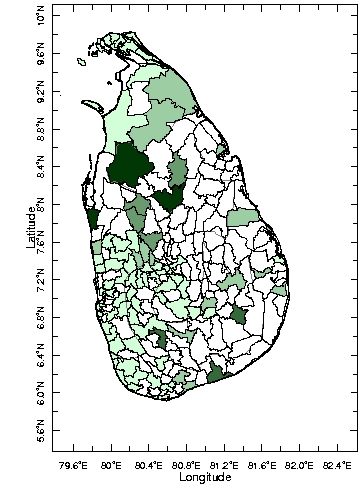
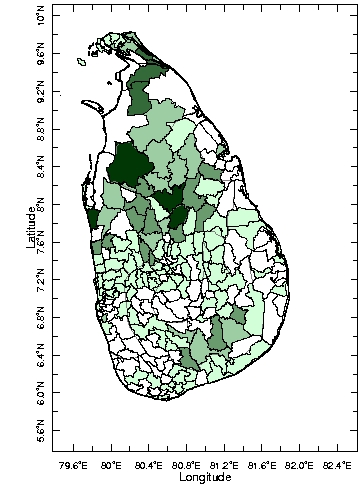
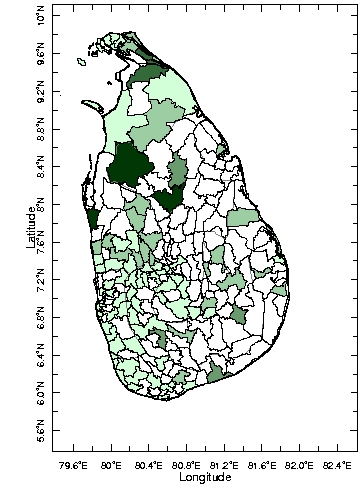


Figure 3 - Clusters by district. From left to right: 1972-1990, 1990-2003 and 1972-2003.
In order to understand better this triple cluster analysis, it is necessary to have a look and compare the structure time series. The link on the side shows only the graphs corresponding to the whole 1972-2003 analysis so you'll have to believe what is said here. The 1972-2003 analysis has a lot of gaps because of the lack of data (districts with less than half the complete time series are discarded). The two other subsets help filling the gaps. First, the first cluster is the same in each case and regroups the four districts shown on 1990-2003 map. They are associated with that series of strong events occuring form 1985 to 1995. Then, the second cluster in 1972-2003 and 1990-2003 are the same and have no equivalent in 1972-1990 probably because of a lack of data. They are those two north districts, which experienced a series of strong events from 1995 to 2003. Eventually, the second cluster from 1972-1990 acts as the third cluster of 1972-2003 and the third one might act as the fourth one respectively. The remaining clusters are harder to link as the amplitude of their structures are weak and identified with difficulty.
Because of the inhomogeneous sampling of the data, the analysis might be biased by the sampling. Figure 4 shows the number of data by districts.
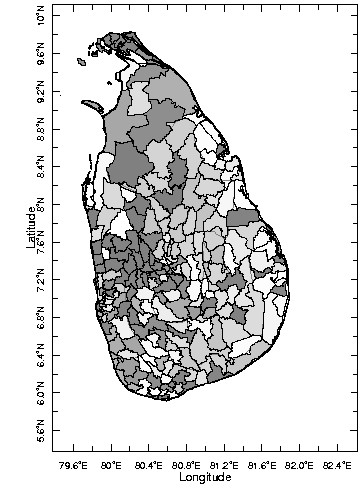

Figure 4 - Number of data (or if preferred of months with data) from 1972 to 2003.
From here it doesn't appear obvious that the sampling influences too much the cluster analysis. As can be seen in the time series structures, the clusters are mainly defined over the thirty years by events of different amplitudes and lasting for from a few years to a decade (1974-1977, 1985-1995 and 1995-2003). However it is easy to notice that those long lasting events show a seasonal variability as they occur. Therefore, to complete this study, a cluster analysis is performed on the climatology of this dataset. This would reveal the seasonal pattern of the variability of the disease.
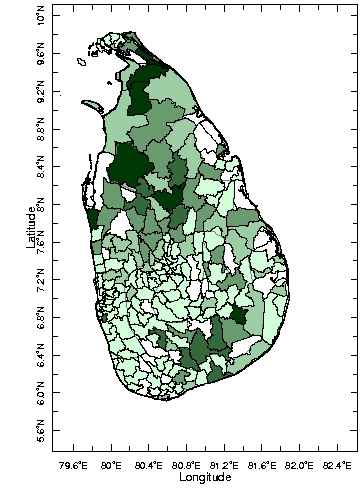

Figure 5 - Clusters by district performed on the climatology of total number of malaria cases reported from 1972 to 2003.
One can see that the time variability is always the same with pike cases/month in December-January. The difference between clusters simply reveals the amplitude of such a seasonal cycle, as the link on the side shows.