Issues in analyzing gappy Malaria data
The previous cluster analysis on Sri Lanka malaria data has shown how cautious one should be when studying gappy data. Applying some selections and other filters on the data, as well as gaps filling techniques proved to impact the results of the final cluster analysis. This section highlights the difficulties encountered when selecting data, reconstructing signals and filling gaps. It asks the questions to be investigated to ensure a safe analysis
Shall data be selected?
At first sight, the time series of the dataset show huge gaps that call for a first selection before applying any analysis. Two selections were applied previously by subsetting the time series in two obvious periods (before and after 1990) and by discarding districts having records for less than 50% of the time period. This increased the confidence of the analysis results to come. The SVD analysis is actually discarding some districts in its process, when applied to the complete dataset without previous selection. We want to know which were the districts discarded and why. Figure 1 shows the 66 discarded districts.
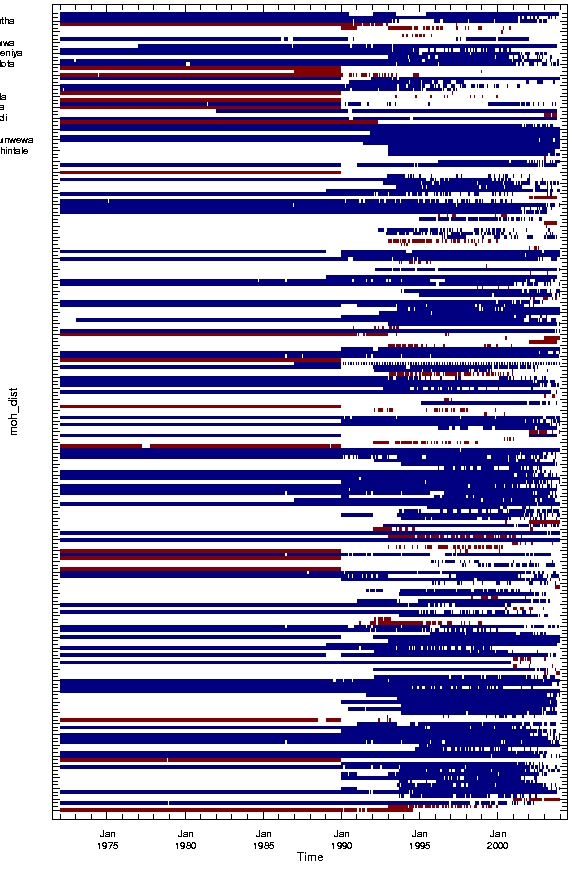 |
Figure 1 - Bottom: ranked by number of points in time series, red districts are the ones discarded by SVD. Left: shows the time pattern of the discarded districts. |
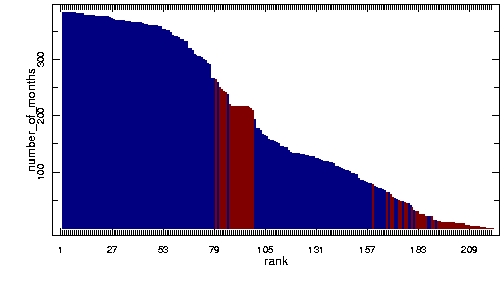 |
Ranking the districts show an expected and another unexpected results. What was expected is that districts with very few data points are discarded because a covariance with other time series could not be calculated. What was unexpected is that a series of districts with a relatively significant amont of data points to be part of the analysis has been discarded. We need to know which ones and why. The left panel shows that near-complete time series from 1972 to 1990, but with not or very few data after 1990 have been automatically discarded, whereas time series with less data points and near-complete time series from 1990 to 2003, but with no data before 1990, have been kept. The SVD code needs to be further investigated to understand this discrimination.
How to fill the gaps?
Let's not forget that the purpose of the SVD is to fill the gap of the original data set. The SVD analysis allows a reconstruction of the signal for all districts at all time by adding up the different structures associated with different egein values. How to choose where to truncate the sum is a source of variability in the final cluster analysis. Because of the gaps and discarded districts, the covariance matrix is approximated and is not definite positive. Therefore, a bunch of negative eigen values are naturally discarded and 93 positive eigen values are left. Pushing the truncation forward could lead on keeping the first modes of which variance sum would not exceed 100% of the original data set variance and leave us with 5 egein values. Figure 2 shows the cluster analysis results for those three options.
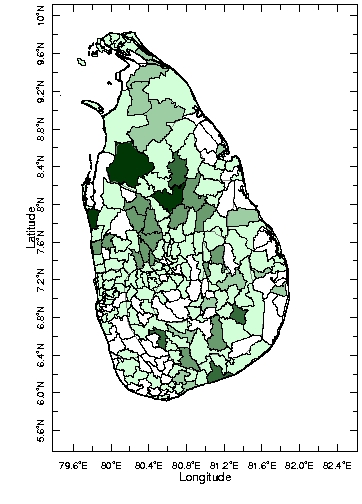
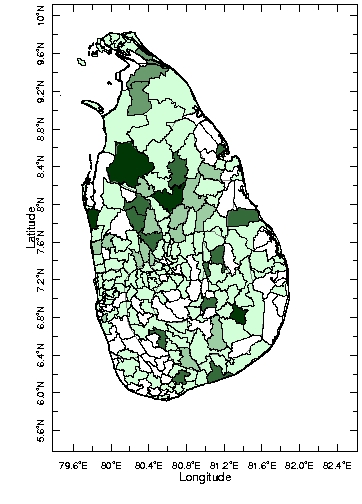
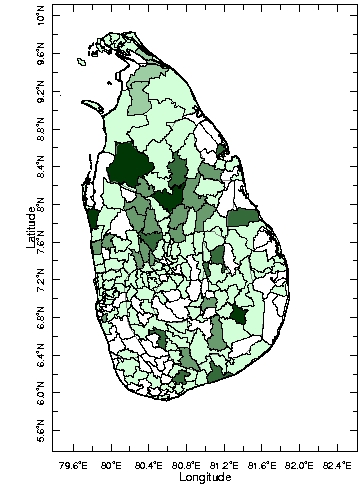


Figure 2 - Cluster analysis from left to right: keeping all 156 modes; keeping 93 positive modes and keeping 5 first modes so that total variance is less or equal to 100% of original variance. Click on the maps to have access to the cluster overview
First, keeping the positives values only shows that the negative modes destroyed the 1995-2003 signal and altered the first years signal. First cluster is roughly the same. The second cluster of the truncated analysis is composed from the second and third clusters of the original analysis. Third cluster is a new one, reprenting the 1995-2003 event that took place in those two northern districts.
So they were significant changes due to this first truncation. The second truncation, keeping only the first 5 modes, has kept the first cluster unchanged, but the third cluster has declined to the fourth rank. Some districts have been exchanged between the other major clusters. Once again, the truncation solution had a serious impact on the result of the analysis. And once again, further investigation on the SVD code might lead to a method to choose where to truncate and then to validate that choice.
The litterature suggests that truncation can be validated thanks to cross validation technics. As well, more complicated itirative methods, relying on SVD or similar technics, to fill gaps can be found.