Malaria and Seasonal Climate in Sri Lanka
Climatological temperature, precipitation and malaria anomalies SVD analysis are put together to investigate the relationships between climate and malaria in Sri Lanka.
Precipitation
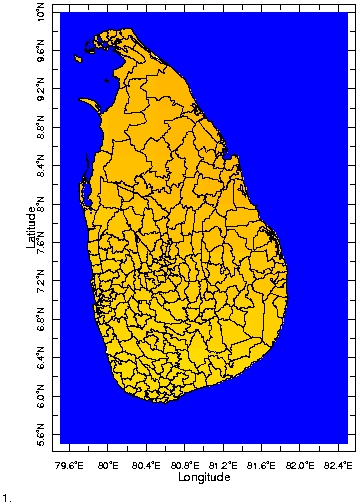
The two first modes are shown in Figure 1. Mode 1, responsible for 92.6% of the variance, shows the general seasonal cycle affecting the whole country with a somehow weaker Yala rainy season in April-May and a stronger Maha rainy season in October-November. Mode 2, responsible for 6.3% of the variance, differentiates the South-West half with both strong Yala and Maha seasons, the latter bieng rather centered on October, from the North-East half where there's almost no Yala season and a Maha season rather centered in Januray-December.


Figure 1 - Time series (top) and Structure (bottom) of the first two modes (left to right) of precipitation seasonal cycle in Sri Lanka.
Temperature
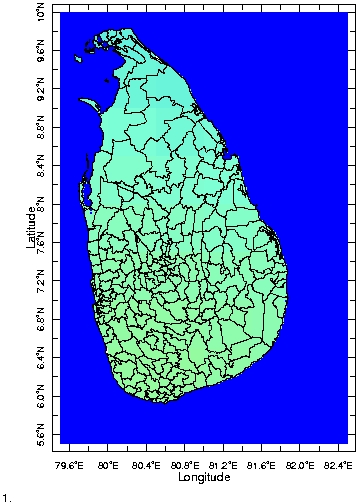
The two first modes are shown in Figure 2. Mode 1, responsible for 98.3% of the variance, shows the general seasonal cycle affecting the whole country with a drop in temperature in boreal Winter and an elevation in boreal Summer. Mode 2, responsible for only 1.4% of the variance, shows that the Summer season starts in the South-West and then propagate to the North-East.


Figure 2 - Time series (top) and Structure (bottom) of the first two modes (left to right) of temperature seasonal cycle in Sri Lanka.
Malaria
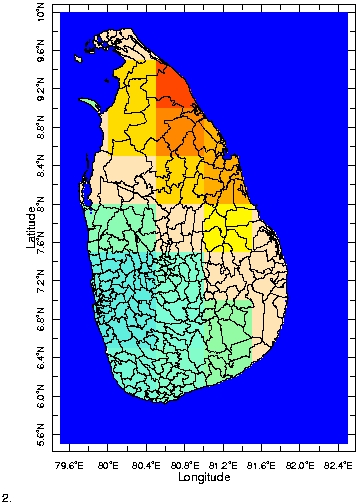
The two first modes are shown in Figure 3. Mode 1, responsible for 83.3% of the variance, shows the general seasonal cycle affecting the whole country with a drop in cases in boreal Summer and a peak in boreal Winter. Mode 2, responsible for 9.2% of the variance, seems to indicate in the center of the country a region where the peak decreases faster at the end of Winter, whereas the it tends to decrease slowerly in an Eastern crescent.


Figure 3 - Time series (top) and Structure (bottom) of the first two modes (left to right) of malaria seasonal cycle in Sri Lanka.
It is easy to see the correlation in time and space between the first modes of the three variables (preicpitation, temperature and malaria). It is noticeable that the time series for malaria and temperature are very similar, whereas the precipitation season is a few month ahead of the malaria one. As for the second modes, it is harder to draw conclusions directly.