Weather in Context: Weird Winter or Standard Season?
It’s nearly impossible to pinpoint a particular weather event as caused or made worse by climate change, but during any prolonged duration of exceptional weather, such questions always arise. We want to know if the weather we’re experiencing is actually unusual, if it’s part of larger climatic change and if it’s going to become more or less frequent.
The recent winter weather in the U.S. was no exception. In December, January and February, more than 1 million flights were delayed or cancelled at a cost to the airline industry of $500 million. The lost productivity, extra meals and hotel stays of the 7.8 million passengers who had cancelled flights added up to a cost of $5.3 billion. Cold weather meant increased demand for energy, but it also disrupted oil and natural gas production, refinery, rail and pipeline operations. This combination led to an increase of household heating expenditures by up to 54% for some U.S. households. Salt shortages were widespread, even prompting a state of emergency in Connecticut. Across the Atlantic, the U.K. has experienced extreme flooding.
How unusual has the weather really been?
Sticking to some basic statistics, IRI postdoctoral research scientist John Allen says snowfall this year in New York City, for example, was well above the average 25 inches per winter, but it wasn’t exceptional. “It’s up there with the higher numbers—about the 7th snowiest—but 57 inches doesn’t compare to some previous years, which saw 70 or 80 inches,” Allen says.
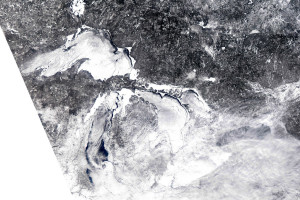
MODIS image of ice cover on Great Lakes. February 16, 2014. Credit: NOAA Great Lakes CoastWatch.
Ice covered more than 90% of the Great Lakes at the beginning of March, the second highest ice cover on record, according to the National Ocean and Atmospheric Administration, and Detroit had its snowiest winter. The U.K. Met Office reports that in southeastern and south-central England, January rainfall was 30% higher than the last record, set in 1988. Wind speeds from storms in the U.K. exceeded 90 miles per hour.
While many places were experiencing record breaking cold weather, other areas were seeing an opposite effect. California’s winter, for example, was its warmest and third driest on record. Averaging over the entire United States, the January mean temperature was 30.3°F, which was just 0.1°F below the 20th century average, Allen says. The mean global temperature for both January and February continued to be above the 20th century average, as it has been every month since 1985.
Climate change and extreme weather
These basic figures begin to help us see how this weather fits into the context of our typical variations in climate, where climate is defined as weather data over long periods of time. Allen and many other climate scientists, however, are also studying how exactly climate change will affect extreme weather. One of the most discussed hypotheses in the media on this topic is the scientific debate about the effect of melting Arctic sea ice on atmospheric conditions, especially the influence of such changes on “looping”, or waviness, of the jet stream. Allen says the winter weather in the U.S. this year appears to be the result of a wavy jet pattern that persisted with a ridge of high pressure in the west—keeping California dry—and a trough in the east—bringing cold, wet weather to the Midwest and East Coast.
The jury is still out on how changes in the physical dynamics of the oceans and atmosphere may influence the frequency and persistence of such waviness in the jet stream and how it might influence weather in a given location.
IRI’s chief climate scientist, Simon Mason, says the argument isn’t really about whether global warming will cause the jet stream to start behaving in new ways. “The jet stream has behaved in similar ways to this last winter many times in the past. The concern is that it will become more frequent,” he says. However, even if a looping jet stream does become more frequent, it doesn’t necessarily mean New Yorkers will see a lot more snowy winters, because those depends on whether the troughs and ridges will persist in the same location as they have this year. “New York could also have unusually warm and dry winters,” Mason says.
Short-term forces
Natural climate variability on timescales shorter than climate change may have also influenced this winter’s weather. For much of this winter, sea-surface temperatures in the central Pacific were normal, but in January they turned slightly cooler than average, causing very weak La Niña conditions for a few weeks. It’s possible that such conditions had effects on atmospheric conditions beyond the Pacific, says Mason.
“A strong La Niña doesn’t necessarily have stronger impacts than a weak La Niña. Ultimately, it is how the atmosphere responds to La Niña that is important,” he says. For example, during La Niña, Indonesia typically experiences heavy rain, which was the case in some areas during December and January. In turn, this can trigger a cascade of atmospheric effects that would cause parts of the U.S. to experience unusual weather.
But as one moves further east, the effects stemming from weather in Indonesia generally get weaker, so it’s difficult to say how much the La Niña conditions influenced the jet stream over the U.S. and U.K.
“La Niña events affect the jet stream, but just as the edge of a flag that is furthest from the pole will flap around more freely than the edge that is close to the pole, so also the jet stream behaves more freely the further it is from the Indonesian area. The floods that occurred in England or the snow in the eastern US are not a consistent feature of La Niña conditions, but the dryness in California was fairly typical,” says Mason.
Such variability in weather patterns underscores the need for skill in seasonal climate forecasting. If these types of winters, or any extreme weather, can be predicted a month or more in advance, decision makers can better prepare. This winter, however, NOAA’s Climate Prediction Center predicted that a large swath of the country would see above-average temperatures. The IRI’s October forecast for November, December, and January also indicated enhanced probability for above average temperatures.
Mason says predicting how the jet stream will behave beyond a few days is very difficult.
“Our models are not very successful in predicting the kind of stagnation in the position of the jet stream we have seen this season. What we can do is indicate how likely it is to get similar kinds of unusual weather in the future, which is why we issue the forecasts as probabilities. While the probabilities are supposed to give an indication of what is most likely to happen, I like to paraphrase Aristotle in cases like this: it is in the very nature of probability that improbable things will happen,” he says.
Recognizing the difficulty of climate predictions, Mason, Allen and their IRI colleagues work to improve understanding of future climate and our abilities to predict weather and climate across multiple timescales. In addition to trying to improve the climate models, IRI also tries to get the best use out of current technology and capabilities.
“For example, understanding recent trends and analyzing the cause of unusual seasons can be very valuable even in areas where we may not be able to make good predictions,” Mason says. “The results of such research may tell us how unusual recent conditions are, which helps us quantify uncertainty in future seasons as accurately as possible. Analyzing recent trends can help us identify whether we are as well prepared as we think we are,” he says.
You must be logged in to post a comment.