IRI Data Library Hosts New Experimental Forecasts
Two new extended-range weather forecast databases are now more accessible to public and researchers
Wouldn’t it be nice to know now what the weather is going to be for the vacation you have planned next month? Or, if you’re a farmer, whether you’re going to get enough rainfall during a crucial planting time coming up in a few weeks? Weather forecasts help us make decisions about the next few days to a week, and seasonal climate forecasts give us information on the time scale of three months to a year or more. But a significant gap in scientists’ understanding has limited the ability to forecast what will happen two weeks to two months from now, also called the subseasonal scale. Scientists are starting to produce experimental subseasonal climate forecasts, exploring, for example, the prediction of conditions related to the recent hurricanes to strike the United States. Easy public access to those forecasts has been limited, until now.
Two new datasets available in the IRI Data Library allow access to 60 terabytes of climate forecasts containing predictions of rainfall, temperature, winds and other variables at the subseasonal level. Researchers can also take advantage of the computational power of the Data Library, including the ability to visualize and analyze the new data online without having to download it.
One of the datasets makes subseasonal forecasts available from 11 out of 13 of the World Meteorological Organization’s official long-range forecasting centers. This dataset, called the S2S Database, underpins the international Subseasonal to Seasonal (S2S) Prediction Project, said Andrew Robertson, who heads IRI’s climate team and is the co-chair of the S2S Project. The WMO’s World Weather and World Climate Research Programs created the project in 2013 to improve forecasts and understanding on timescales of two weeks to a season, filling the gap between daily weather and seasonal climate forecasts. WMO also wants to promote use of the forecasts for better early warning of high impact weather events such as floods and droughts, and heat and cold waves.
While the S2S Dataset is also available at two official S2S archiving centers (ECMWF and CMA), the IRI Data Library version brings a large subset of the S2S database online so that it is accessible “in the cloud” using any web browser, even on a tablet or smart phone. Researchers can also more easily assess S2S forecast accuracy using the Data Library’s extensive datasets of observed climate conditions.
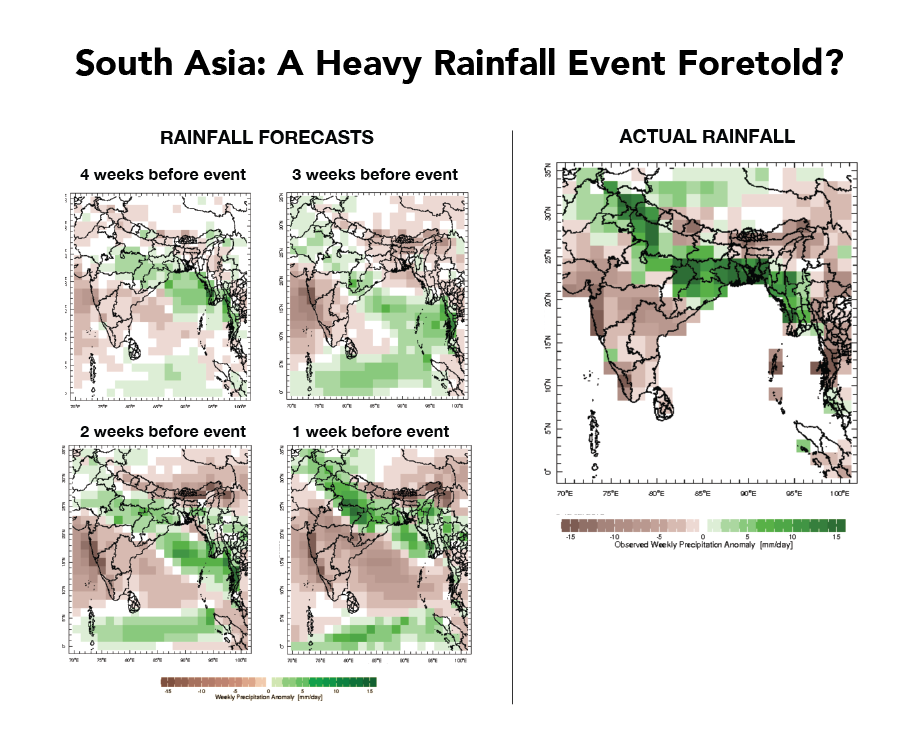
The set of figures on the left show precipitation forecasts in the four weeks leading up to a heavy rainfall event that happened in southern Asia in the week of July 6-12, 2015. The map on the right shows the rainfall observed during that same event. The forecast maps show weekly precipitation anomalies (in mm/day), starting with a forecast four weeks ahead of the event (June 15 – Week 4), and continuing with forecasts on June 22 (Week 3), June 29 (Week 2) and July 6 (Week 1). The observed rainfall from July 6-12, 2015, uses the same scale of weekly anomalies for easy comparison. Observed rainfall comes from CHIRPS data, and the forecasts use ECMWF ensemble mean.
“The functionality that the Data Library adds will be particularly relevant for researchers who are working on how subseasonal forecasting data might be used in applications for public health, water resources, agriculture, disaster risk reduction and more,” said Robertson. The coding and data skills required for accessing S2S data from other centers is not a problem for many climate science researchers, such as those doing predictability research or studying model errors. But for those with more of an eye toward applying the forecasts, the process of obtaining the most appropriate data can be unwieldy.
Perhaps most importantly, the IRI Data Library allows users to visualize the S2S data before downloading it. For some, said Robertson, viewing the data – such as weekly averages of forecasted daily rainfall during a past flood event – may be all that’s needed. Others are likely to find it useful for exploratory analysis before downloading.
“We want to expand the ability of the user community who may be in interested in developing forecast products,” said Robertson. “The S2S Project is primarily a research project, but it also seeks to demonstrate the potential for significant socio-economic value of forecasts, to develop new tools and to lay the groundwork for future climate services. This dataset is an important first step.”
Significant for applications development, the IRI Data Library allows virtual “Maprooms” to be created using the S2S data. A Maproom – a platform that starts with a map as the entry point for accessing a range of climate information and analyses – can be adapted to specific user groups and expressed in terms relevant to their decision making.
Because of restrictions in place at many operational forecasting centers, the S2S forecasts are only available three weeks after they are issued.
But the other new subseasonal dataset in the IRI Data Library does offer real-time forecasts. The data come from NOAA’s Subseasonal Experiment (SubX) research project, which combines North American global models from NOAA, NASA, Environment Canada, the Navy, and National Center for Atmospheric Research to produce once-a-week real-time experimental sub-seasonal forecasts. The SubX dataset provides similar variables to the S2S Dataset, including a set of forecasts for past dates (also called reforecasts), and is being made available for the research community in the Data Library.
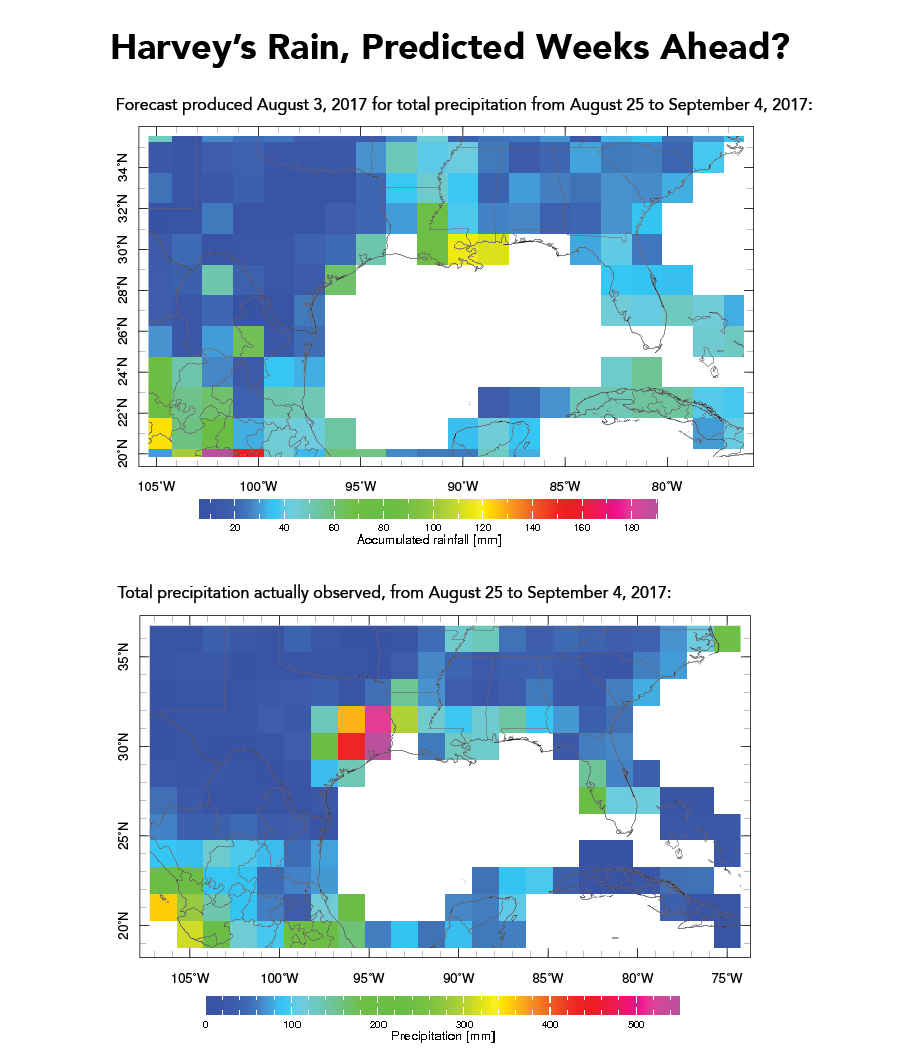
The top figure shows the rainfall prediction made August 3, 2017 for the time period a few weeks later (Aug 25-Sept 4) when Hurricane Harvey hit the southern coast of the United States. The bottom figure shows the observed rainfall that occurred from Aug 25- Sep 4. Although the prediction for the exact location of the heaviest rains was off by about 300 miles, and the overall magnitude of the event was significantly underestimated, the forecast shows promise for predicting regions likely to be vulnerable to coming extreme events. While this example serves as an indication of what might be predictable a few weeks out, scientists will have to examine this and many more events before determining if such forecasts should be operational. Figures created by Ángel Muñoz using the IRI Data Library. Graphics of observed rainfall use NOAA data, and the forecasts use ECMWF.
Between the two datasets, IRI now houses around 60 terabytes of subseasonal climate forecasting data. This much data couldn’t simply be copied to IRI from the S2S archiving center at ECMWF, or from the SubX forecasting centers. A large part of the S2S data was transferred thanks to two Columbia University projects funded by NOAA’s Modeling, Analysis, Predictions, and Projections Program. Members of IRI’s Data Library team then coded special files to translate the forecasts into a format readable by the Data Library. This translation is also what allows for the more user-friendly interface, and for the possibility of deriving forecast products within the Data Library.
“The bookkeeping and constructing of all those files turned out to be quite a job,” said Robertson.
IRI’s Michael Bell and Jing Yuan did most of the data work on the files. For each of the 11 models in the S2S dataset, for example, they created code tailored for each variable in the models, with the number of variables per model ranging from 17 to 44, said Bell. They also had to make sure their “translations” accounted for other eccentricities that differ between the models — such as how many different times the forecasts are run and how many days into the future the forecasts are predicting. And, they standardized naming conventions across all of the forecasts. The team took similar steps to make sure the SubX dataset was compatible with the IRI Data Library.
“The S2S Database and SubX datasets are very complementary,” said Ben Kirtman, lead of the SubX project team. “The focus with the S2S data is forecasts from operational centers, whereas the SubX data includes forecasts from research models.”
Ángel Muñoz, a post-doctoral researcher at Princeton and IRI, said the datasets have already been useful during trainings he’s conducted abroad.
“The in-the-cloud availability of data and computational capacity provided by the Data Library permits the students to focus on the actual problems of interest, instead of spending time downloading data in the lab sessions,” said Muñoz. “This is of special importance in countries where the internet tends to be a bit slower.”
The new additions are also already making it more efficient for researchers based in the U.S. to get their work done. Kathy Pegion, an assistant professor at George Mason University who is a lead researcher with the SubX project, said that her work involves evaluating models to improve forecasting, especially at the three to four week timescale.
“It’s not always easy to get access to the global models from around the world,” said Pegion. With both the S2S and SubX datasets in the Data Library, she said, it makes it easier to compare more models, and lead to a better understanding of large scale climate drivers and sources of climate predictability.
Housing the S2S and SubX data at IRI was made possible through grants from NOAA Research’s Modeling, Analysis, Predictions, and Projections Program, and the National Weather Service Next Generation Global Prediction System program. Collaboration with Suzana Camargo, Shuguang Wang and Haibo Liu at Columbia University through their NOAA MAPP (NA16OAR4310079; NA16OAR4310076) and NSF (#1543932) projects is gratefully acknowledged.
You must be logged in to post a comment.