IRI
Climate Digest Volume 3, Number 1: January 2000
January-March
Climate Outlook
Date and
Period of Forecast In
January 2000, the IRI
Experimental Forecast Division prepared a Climate Outlook for January-March
2000. Here we provide a subset of the January Net Assessment Forecast.
The complete forecast, which includes global forecasts for April-June 2000,
can be found at http://iri.columbia.edu/climate/forecast/net_asmt/.
Uncertainties
This Climate Outlook
is dependent on the quality of the SST predictions [link to Ocean below].
For the tropical Pacific, these predictions can be expected to provide
useful information, but there is some uncertainty concerning the detailed
evolution of SSTs. Spread in global SST predictions is a source of
uncertainty in the Outlook provided here. The procedures, models, and data
used to derive this Climate Outlook may be somewhat different from those
used by National Meteorological Services in particular regions and may
differ from the official forecasts issued in those areas.
Regional
Influences The
current status of seasonal-to-interannual climate forecasting allows prediction
of spatial and temporal averages, and does not fully account for all factors
that influence regional and national climate variability. This Outlook
is relevant only to seasonal time scales and relatively large areas; local
variations should be expected. For further information concerning this
and other guidance products, users are strongly advised to contact their
National Meteorological Services.
Precipitation
Outlook The Outlook for
January-March 2000 can also be found at http://iri.columbia.edu/climate/forecast/net_asmt/.
Maps
are given showing expected precipitation probabilities in tercile
classes. The maps indicate probabilities that seasonal precipitation will
fall into the wettestthird
of the years (top number), the middlethird
of years (middle number) or the driestthird
of the years (bottom).
An
outlook of climatology "C" (light grey) indicates equal probabilities
in each class; i.e., there is no basis for favoring the forecast of any
particular category.
Areas
marked "D" (dark grey) experience a pronounced dry season during
the forecast period, typically receiving less than 15% of their annual
precipitation or less than 5 cm total during this three-month period.
Boundaries
between sub-regions should be considered transition zones, and their location
considered to be only qualitatively correct.
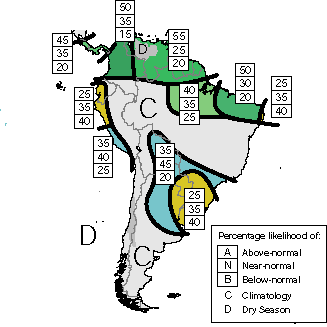
South America
The following regions of enhanced
probabilities of precipitation anomalies are indicated:
P.A)
enhanced probabilities of above-normal precipitation over Panama and much
of Costa Rica
P.B)
greatly enhanced probabilities of above-normal precipitation over much
of Colombia
P.C)
strongly enhanced probabilities of above-normal precipitation over an area
extending from easterm-most Colombia though French Guiana to 50E, north
of the Equator
P.D)
greatly enhanced probabilities of above-normal precipitation over the northeast
region of Brazil
P.E)
slightly enhanced probabilities of below-normal precipitation over the
east-facing coast of northeast Brazil
P.F)
slightly enhanced probabilities of above-normal precipitation over north-central
Brazil
P.G)
slightly enhanced probabilities of below-normal precipitation over the
western portions of Ecuador and northern Peru
P.H)
slightly enhanced probabilities of near-normal precipitation over the western
part of southern Peru
P.I)
slightly enhanced probabilities of below-normal precipitation over Uruguay,
northeastern Argentina southern Brazil, and eastern Paraguay
P.J) enhanced probabilities of
near-normal to above-normal precipitation over a large region encircling
that of P.I, including north-western Argentina, western Paraguay, eastern
Bolivia, and a narrow zone through southern Brazil
Australia and Indonesia
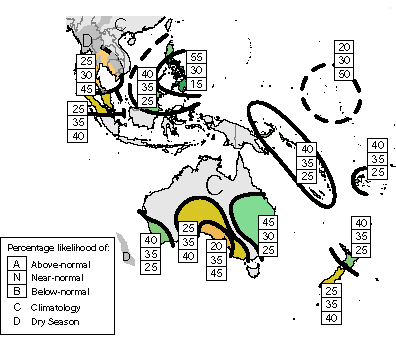 January-March 2000 Precipitation probabilities
 |
The following regions of enhanced probabilities
of precipitation anomalies are indicated:
P.A) enhanced
probabilities of below-normal precipitation over most of Thailand, the
southernmost part of Myanmar, south-western Cambodia, and the south-westernmost
part of Vietnam
P.B) slightly enhanced
probabilities of below-normal precipitation over the northern half of Sumatra,
and western Malaysia
P.C) slightly enhanced
probabilities of above-normal precipitation over northern Phillipines,
and north central Indonesia
P.D) greatly enhanced
probabilities of above-normal precipitation over most of the Philippines
(a slightly enhanced risk of extremely wet conditions is indicated)
P.E) greatly enhanced
probabilities of below-normal precipitation over the Marshall Islands
P.F) slightly enhanced
probabilities of above-normal precipitation over the Solomon Islands, Vanuatu,
and New Caledonia
P.G) slightly enhanced
probabilities of above-normal precipitation over Fiji
P.H) slightly enhanced
probabilities of above-normal precipitation over south-western Australia
P.I) slightly enhanced
probabilities of below-normal precipitation central southern Australia
P.J) enhanced probabilities
of below-normal precipitation over southern Australia
P.K) enhanced probabilities
of above-normal precipitation over eastern Australia
P.L) slightly enhanced
probabilities of above-normal precipitation over North Island, New Zealand
P.M) slightly enhanced probabilities of below-normal
precipitation over South Island, New Zealand.
Temperature OutlookThe
Outlook for January-March 2000 can also be found at http://iri.columbia.edu/forecast/net_asmt.
The
temperature map shows expected probabilities that the seasonal temperatures
will fall into the warmest third
of the years (top number), the middle
third of the years, or the coldest
third of the years (bottom number).
A
qualitative outlook of climatology "C" (light grey) indicates equal probabilities
in each class i.e.; there is no basis for favoring the forecast of any
particular category.
Boundaries between sub-regions
should be considered transition zones, and their location considered to
be only qualitatively correct.
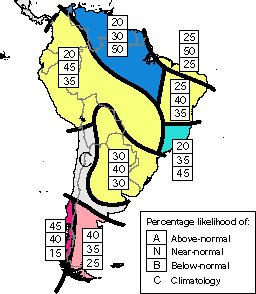
South America
The following regions of enhanced
probabilities of temperature anomalies are indicated:
T.A)
greatly enhanced probabilities of below-normal temperatures over northern
South America from Venezuela to north-western Brazil
T.B)
greatly enhanced probabilities of near-normal temperatures over the north
coastal region of Brazil
T.C)
slightly enhanced probabilities of near-normal to below-normal temperatures
in the region of eastern Brazil occupied by the state of Bahia
T.D)
enhanced probabilities of near-normal to below-normal temperatures over
western South America including Colombia, Ecuador, Peru, north-western
Bolivia, and western and central Brazil
T.E)
slightly enhanced probabilities of near-normal temperatures over an area
including eastern Bolivia, Paraguay, southern Brazil, Uruguay, and northeastern
Argentina
T.F)
enhanced probabilities of below-normal temperatures over central eastern
Brazil, covering much of the states of Minas Gerais and Espirito Santo
T.G)
enhanced probabilities of above-normal temperatures over southern Chile
T.H) slightly enhanced probabilities
of above-normal temperatures over southern Argentina
Australia and Indonesia
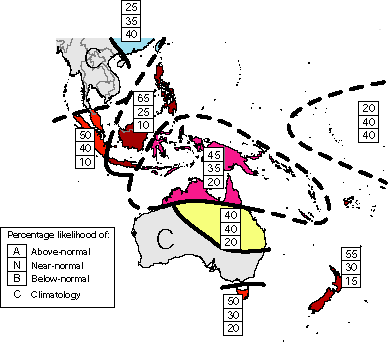 January-March 2000 Temperature Probabilities
 |
The following regions of enhanced
probabilities of temperature anomalies are indicated:
T.A)
slighthly enhanced probabilities of below-normal temperatures over south-eastern
China
T.B)
greatly enhanced probabilities of above-normal temperatures over Sumatra
and western Malaysia
T.C)
greatly enhanced probabilities of above-normal temperatures over Java,
Borneo, and the Philippines
T.D)
enhanced probabilities of above-normal temperatures over eastern Indonesia,
New Guinea, Solomon Islands, Vanuatu, New Caledonia, and the northern part
of Australia
T.E)
enhanced probabilities of above-normal to normal temperatures over central
and eastern Australia
T.F)
greatly enhanced probabilities of above-normal temperatures over Tasmania
T.G)
greatly enhanced probabilities of above-normal temperatures over New Zealand
T.H) enhanced probabilities of
below-normal to normal temperatures over Nauru, Kiribati, and Tuvalu
Ocean ConditionsOf
relevance in the preparation of this Outlook has been the current weak
La Niña conditions (lower than average sea surface temperatures
(SSTs) in the central equatorial Pacific Ocean) that have been amplifying
through the end of 1999 and are expected to decline slowly through the
forecast period. The SSTs of the western tropical Indian Ocean were assumed
to remain near-normal, and the above-average SSTs of the eastern tropical
Indian Ocean are expected to return to normal during the forecast period.
The forecast of the tropical North Atlantic SSTs suggests a cooling trend
through June 2000.
Methods The
following procedures and information were used to prepare this Climate
Outlook:
Coupled ocean-atmosphere
model predictions of tropical Pacific SST. Particularly heavy weighting
has been given to the NOAA /NCEP, Climate Modeling Branch coupled model.
Statistical forecasts
of Indian Ocean and Atlantic Ocean sea surface temperature.
The response of
Atmospheric global circulation model (GCM) predictions to the present and
predicted SST patterns.
Statistical analyses.
Appropriate Regional Climate Outlook Forum
consensus guidance.
|