- Home
- Our Expertise
- Climate
- Climate and Forecast Products
Climate and Forecast Products
Access IRI’s extensive collection of forecast, monitoring, and analysis products, including IRI’s real-time seasonal climate and ENSO forecasts.
Seasonal Climate Forecasts
  |
 |
 |
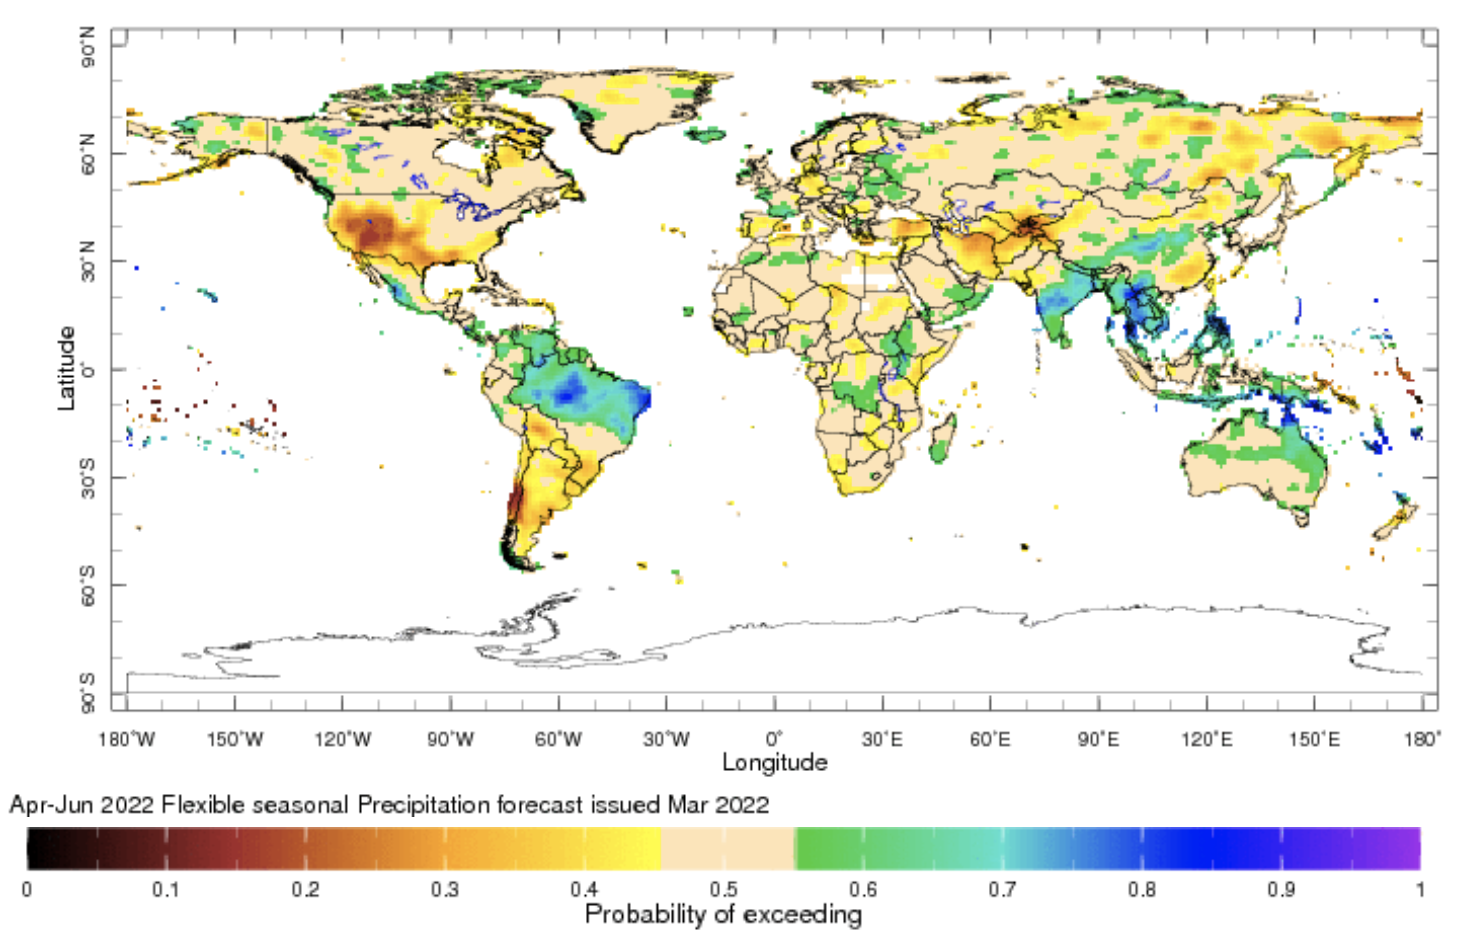
| IRI’s Seasonal Climate Forecasts are updated every month for the next 6 months into the future. They give probabilistic outlooks for temperature and precipitation to be in the above-normal, near-normal, or below-normal tercile categories, which are defined from the previous 30 years. | Flexible Format Seasonal Climate Forecasts are based on the same forecast information as the Seasonal Climate Forecasts. They give probabilistic outlooks for temperature and precipation based on categories or thresholds chosen by the user. | The Seasonal Forecast Verifications page provides skill assessment of IRI’s real-time forecasts issued from 1997 to present. |
The IRI probabilistic seasonal climate forecast product is based on a re-calibration of model output from the U.S. National Oceanographic and Atmospheric Administration (NOAA)’s North American Multi-Model Ensemble Project (NMME). This includes the ensemble seasonal prediction systems of NOAA’s National Centers for Environmental Prediction, Environment and Climate Change Canada, NOAA/Geophysical Fluid Dynamics Laboratory, NASA, NCAR and COLA/University of Miami. The output from each NMME model is re-calibrated prior to multi-model ensembling to form reliable probability forecasts. The forecasts are now presented on a 1-degree latitude-longitude grid.
Details of the forecast system, post-processing, and recommended references for citation can be found here. Forecasts from the individual NMME models are shown on NOAA CPC’s website. Verifications of IRI’s real-time forecasts issued since 1998 can be found on the Seasonal Climate Verifications pages.
A complete list of all IRI’s extensive climate and forecast products both past and present are available in http://iridl.ldeo.columbia.edu/maproom/Global/Forecasts/. Access all climate monitoring and analysis maprooms here.
ENSO Forecasts
 |
||
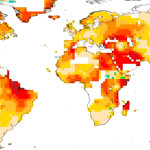
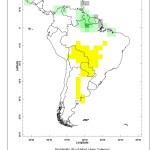
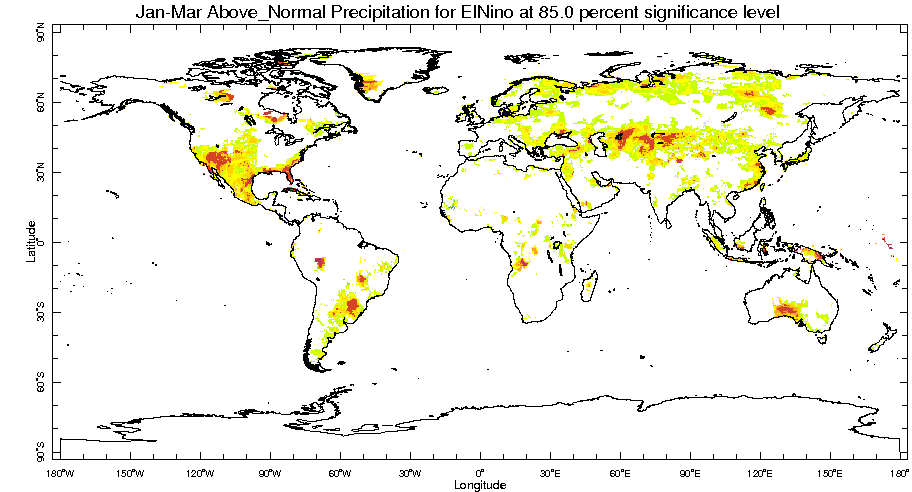
| The Current ENSO Forecast provides a monthly summary of the status of El Niño, La Niña, and the Southern Oscillation, or ENSO, based on the NINO3.4 index (120-170W, 5S-5N). | The Current Plume of ENSO Model Predictions show forecasts made by dynamical and statistical models for SST in the Nino 3.4 region for nine overlapping 3-month periods. | ENSO rainfall teleconnection maps examine how frequently observed precipitation was in the above-normal, near-normal, or below-normal tercile category during the 10 largest El Nino and La Nina events between 1950 and 2002. |
A comprehensive list of IRI’s ENSO maps and analyses are available in the ENSO Resources Page.
Experimental Subseasonal Climate Forecasts
 |
 //var/parameter/(Percentile)/eq/%7Bdup/0/get/aload/pop/pop/nip/a%3A/ind/2/VALUE/ind/removeGRID/%3Aa%3A/ind/0/VALUE/ind/removeGRID/%3Aa/50.0//percentile/parameter/100.0/div/dup/-1.0/mul/1.0/add/div/ln/exch/sub/exch/div/dup/dataflag/1/masklt/exch/0.0/max/mul%7D%7B15.0//threshold2/parameter%7Difelse/exch/%7Baload/pop/nip/a%3A/ind/2/VALUE/ind/removeGRID/%3Aa%3A/ind/0/VALUE/ind/removeGRID/%3Aa%3A/ind/1/VALUE/ind/removeGRID/%3Aa/4/-1/roll/mul/add/exch/counttomark/1/sub/index/mul/add/eexp/dup/1.0/add/div%7Dforall/counttomark/1/sub/dup/1/add/1/roll/counttomark/3/sub/%7Badd%7Drepeat/exch/div/(exceeding)//proba/parameter/(exceeding)/eq/%7B-1/mul/1/add/startcolormap/DATA/0/1/RANGE/transparent/black/RGBdup/0/VALUE/brown//percentile/get_parameter/100.0/div/-1.0/mul/1.0/add//probref/parameter/0.05/sub/3.0/div/VALUE/orange//probref/get_parameter/0.05/sub/3.0/div/2.0/mul/VALUE/yellow//probref/get_parameter/0.05/sub/VALUE/moccasin/RGBdup//probref/get_parameter/0.05/add/bandmax/LimeGreen//probref/get_parameter/0.05/add/0.005/add/VALUE/turquoise//probref/get_parameter/0.05/add/2.0/mul/1.0/add/3.0/div/VALUE/blue//probref/get_parameter/0.05/add/2.0/add/3.0/div/VALUE/purple/1/VALUE/purple/endcolormap%7D%7Bstartcolormap/DATA/0/1/RANGE/transparent/purple/RGBdup/0/VALUE/blue//percentile/get_parameter/100.0/div//probref/parameter/0.05/sub/3.0/div/VALUE/turquoise//probref/get_parameter/0.05/sub/3.0/div/2.0/mul/VALUE/LimeGreen//probref/get_parameter/0.05/sub/VALUE/moccasin/RGBdup//probref/get_parameter/0.05/add/bandmax/yellow//probref/get_parameter/0.05/add/0.005/add/VALUE/orange//probref/get_parameter/0.05/add/2.0/mul/1.0/add/3.0/div/VALUE/brown//probref/get_parameter/0.05/add/2.0/add/3.0/div/VALUE/black/1/VALUE/black/endcolormap%7Difelse//var/get_parameter/(Percentile)/ne/%7Bnip/correlationcolorscale/DATA/0/1/RANGE/dup%7Dif//long_name/(Probability%20of%20)//proba/get_parameter/append/def/3/-1/roll/pop/%7Btarget_date/percentile_val/forecast%7Dds//name//flexfcst/def/a-/.forecast/-a-/.percentile_val/-a-/.target_date/-a/SOURCES/.Features/.Political/.World/a%3A/.secondOrder_GAUL_coarse//name//2nd_order/def/.the_geom/%3Aa%3A/.firstOrder_GAUL_coarse//name//1st_order/def/.the_geom/%3Aa%3A/.Countries_GAUL_coarse//name//countries/def/.the_geom/%3Aa/X/Y/fig-/colors/grey/contours/plotlabel/black/stroke/stroke/stroke/blue/rivers_gaz/lakes/thin/streams/int_streams/-fig/L/first/plotvalue/X/-180/180/plotrange//layers%5B//forecast//percentile_val//countries//lakes%5Dpsdef//antialias/true/psdef/S/last/plotvalue/+.auxfig/+.gif) |
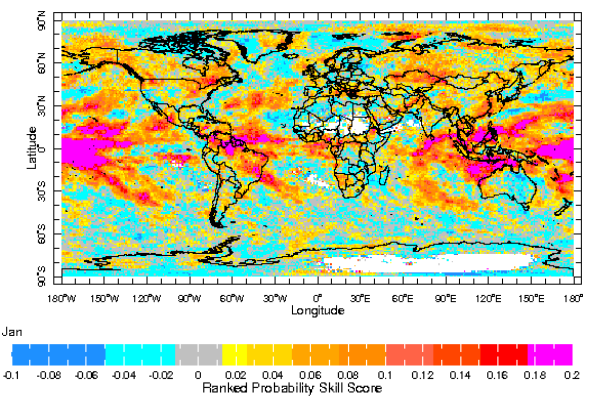 |
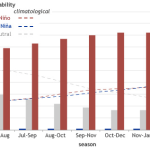
| IRI’s Subseasonal Climate Forecasts are updated every Friday for the next 4 weeks into the future. They give probabilistic outlooks for temperature and precipitation to be in the above-normal, near-normal, or below-normal tercile categories, which are defined from the 1999-2014 period. | Flexible Format Subseasonal Climate Forecasts are based on the same forecast information as the Subseasonal Climate Forecasts. They give probabilistic outlooks for temperature and precipation based on categories or thresholds chosen by the user. | Subseasonal Climate Hindcast Verification provides subseasonal skill scores based on the historical performance of each calibrated SubX model and their three-model ensemble. |
IRI’s Experimental Subseasonal Climate Forecasts provide probabilities of weekly and biweekly averages of precipitation and temperature up to four weeks ahead. They aim to fill the gap between daily weather forecasts and seasonal forecasting, to help inform societal decisions in this range.
These probabilistic forecast maps are constructed from the statistical calibration of three NOAA models (NCEP CFSv2, NCEP GEFS, and NOAA/ESRL FIM HYCOM, each initialized on Wednesdays) from the Subseasonal eXperiment Project (SubX) which are combined with equal weight. Individual model forecasts are calibrated separately for each location, start and lead using Extended Logistic Regression (Vigaud et al, 2017) based on the historical performance of each model.
Tailored Climate Products
IRI works closely with sectoral experts in health, water resources, agriculture and disaster management to identify areas in which climate information can be used for decision making and planning, and to ensure that the information is communicated in the best way and tailored to the needs of the users.
 |
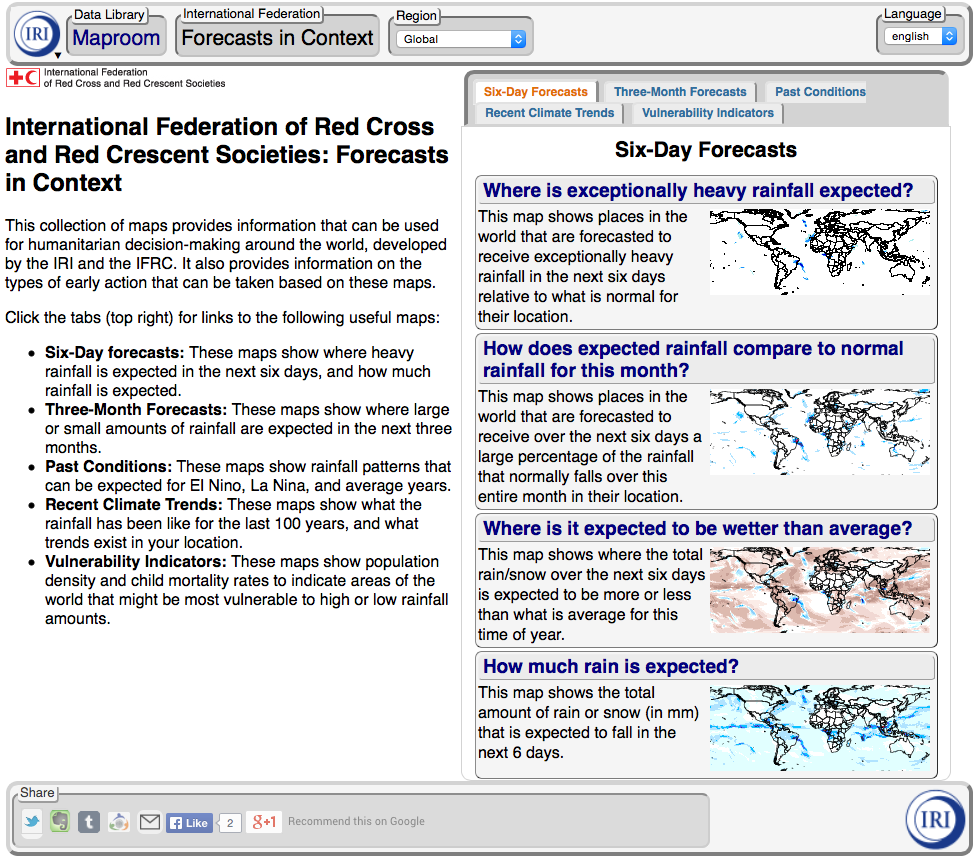 |
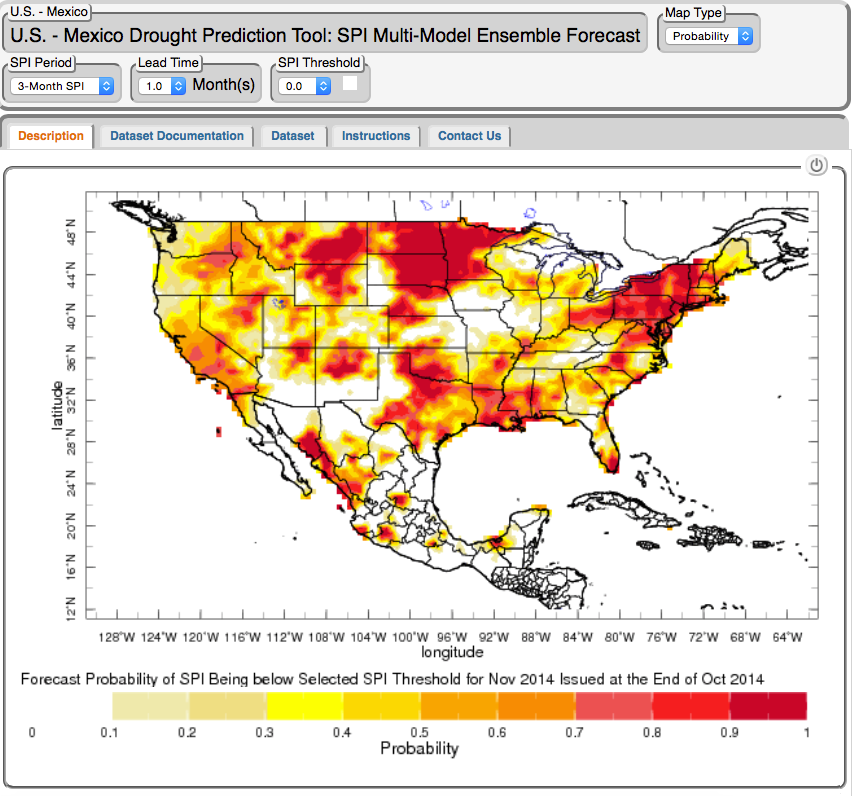
| The US-Mexico Drought Prediction maps provide quantifiable, probabilistic drought predictions for the United States and Mexico over the next few months. | The IFRC Maproom provides tailored, user friendly weather and climate information developed by IRI in partnership with the IFRC to answer specific questions of interest to disaster risk managers. |
 |
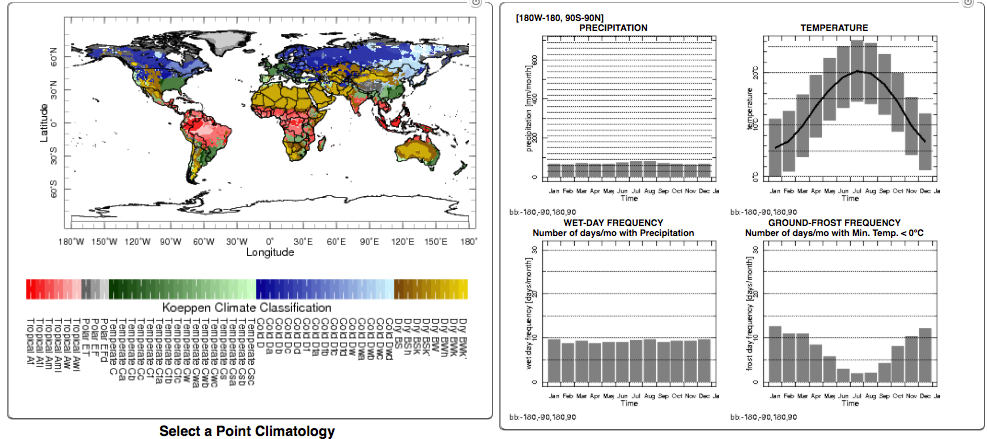 |
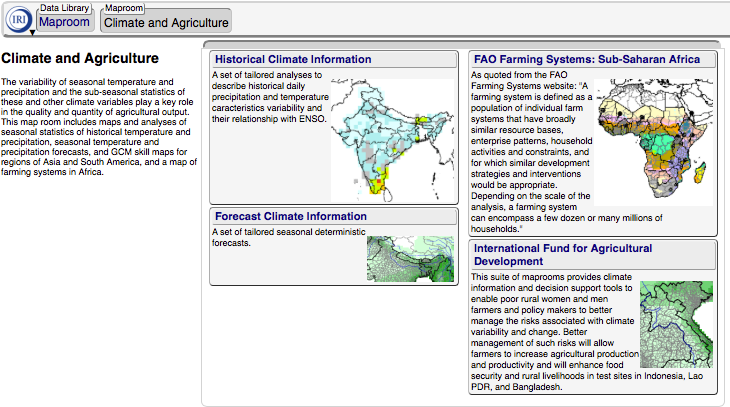
| The Climate and Agriculture Maproom includes seasonal and sub-seasonal climate information and analyses of importance to agriculture, including historical temperature and precipitation, seasonal temperature and precipitation forecasts, and GCM skill maps. | The Select a Point map room for local Temperature and Precipitation Climatology Background map shows topography of the land. This maproom allows one to click on a specific point and see the average seasonal cycle of temperature and precipitation. Like all maproom maps, it is possible to zoom in on a continent or region. |
Climate Change and Decade-Scale Information
 |
|
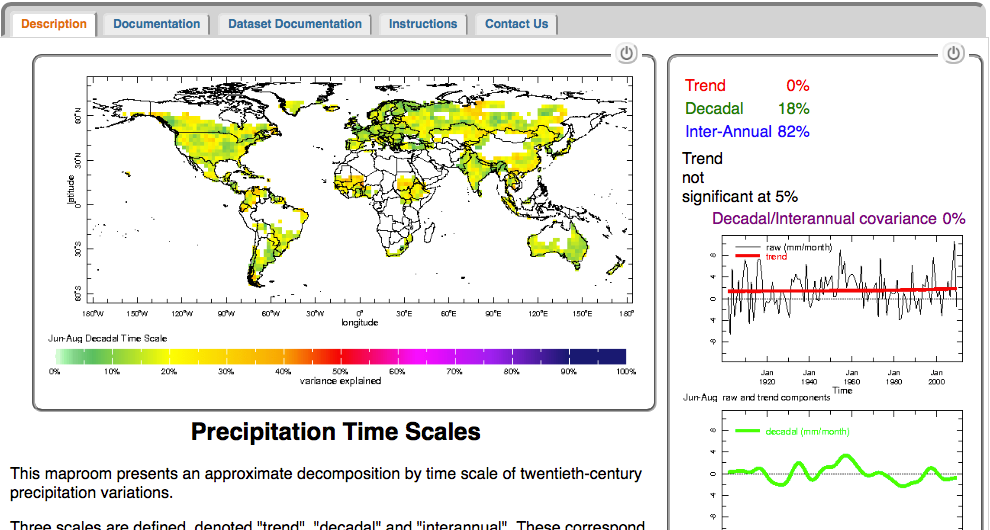
| The Time scales Decomposition Map Room allows one to look at the amount of climate variation contained in climate change trends, decadal-scale variability, or year-to-year variability. There is a brief paper linked to on the map room that provides more details on the methodology, as well as caveats. One can display maps of these quantities, or one can click on a point or select a region for averaging and obtain timeseries of each component. | The Skill assessment of Experimental Decadal Predictions evaluation examines two things: (1) the accuracy of decadal prediction experiments, which were started from ocean conditions close those observed at the beginning of the forecast, compared to the accuracy of climate change projections, which use the same models but do not introduce observed conditions; and (2) how best to estimate uncertainty in the decadal prediction experiments. |